Fertility
When we use the word 'Fertility', what we are referring to is a cows genetic ability to get back in-calf. in other words, her Fertility BV.
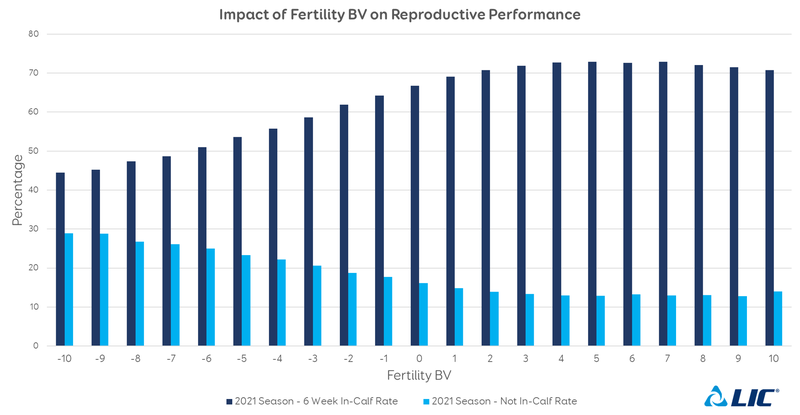
In general, cows that have a higher Fertility BV will get in-calf better/earlier than those with a low/negative Fertility BV. This is demonstrated in Graph 1 below where cows have been ranked by Fertility BV. As we can see, cows with the highest fertility BV (+5) have the highest 6-week-in-calf rate (ICR) and the lowest not-in-calf rate (NICR).
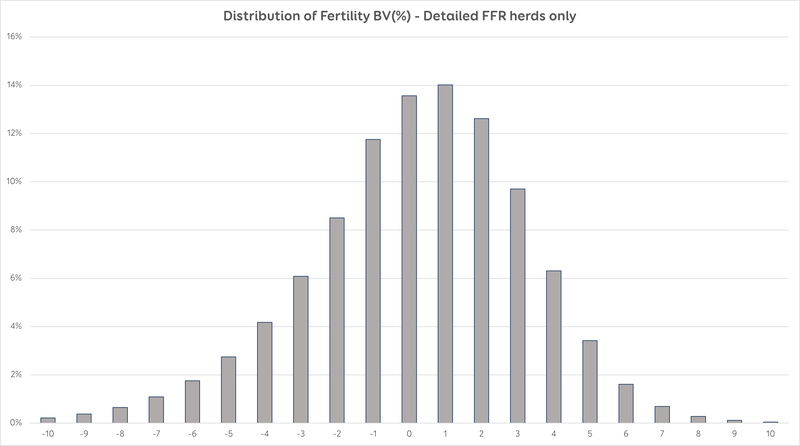
The national average cow Fertility BV is 0.7, and 69% of cows in New Zealand have a Fertility BV of 0 or higher (shown in Graph 2). This is good news as it means a large proportion of the New Zealand dairy herd is in a positive position for Fertility BV.
Unfortunately, the heritability1 of the Fertility BV is low at around 9%, which makes improving herd fertility a slow process. We have, however, as a country been making gains in Fertility BV over the last couple of decades. The average Fertility BV of the country’s bulls has improved from -0.96 for 2000 born bulls to +0.61 for 2015 born bulls2. A similar upward trend has been followed by the cow populations of all 3 main breeds (Jersey, Holstein-Friesian, Holstein-Frisian x Jersey)3.
For more information on Fertility BV, check out the Breeding Values page on the DairyNZ website.
Reproduction
When we use the word ‘Reproduction’, we are referring to the outcomes of the interaction between genetics and environment. In other words, when/if a cow gets back in-calf (her reproductive performance) is the interaction between her genetic potential to get back in-calf (Fertility BV) and the environment she is in (the management she receives). At the herd level, herd reproductive performance is the interaction between the Fertility BV of the cows in the herd and how the herd is managed. Herd reproductive performance is generally measured as 6-week ICR and NICR.
Why the distinction?
The reason we make this distinction is because getting good herd reproductive performance requires more than just having a herd full of high Fertility BV cows. A herd that has good fertility but isn’t managed well, will still have less than ideal reproductive performance.
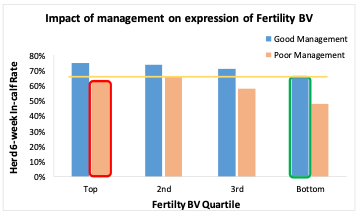
Yes, genetics is one of the 8 key management areas, and is therefore an important factor in achieving good herd reproductive performance. But since the heritability of fertility is only 9%, around 91% of the reason a herd does/does not get in-calf well is the way the herd is managed. This is demonstrated by Graph 3.
Graph 3 shows the reproductive performance of two herds – one with ‘good management’ (herd average fertility BV of 0.29) and one with ‘poor management’ (herd average fertility BV of 0.24). The cows within each herd were split into quartiles based on their Fertility BV. As we can see, the herd with ‘good management’ had better results across all of the quartiles than the ‘poor management’ herd.
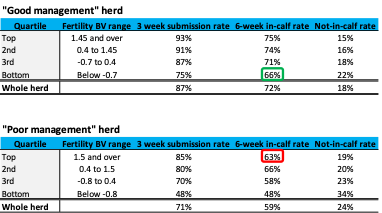
In addition, looking at the yellow line, you can see that the cows in the bottom quartile in the ‘good management’ herd (circled in green) performed better than the cows in the top quartile in the poorly managed herd (circled in red). See the table for more detailed results.
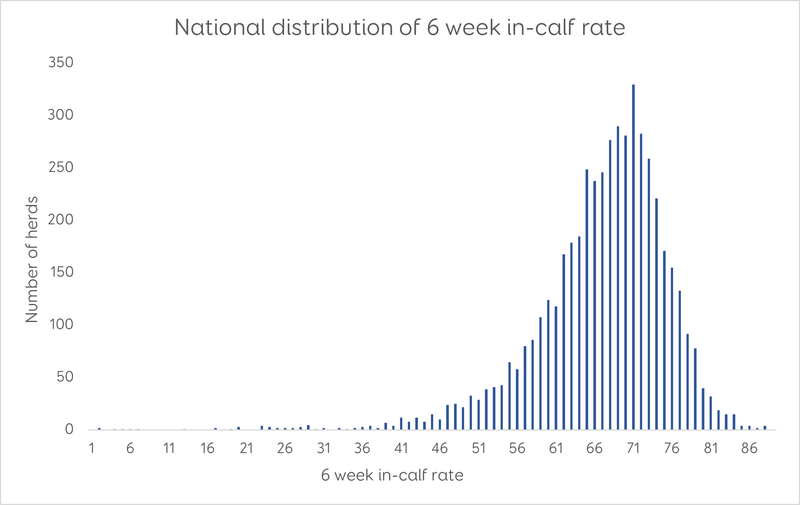
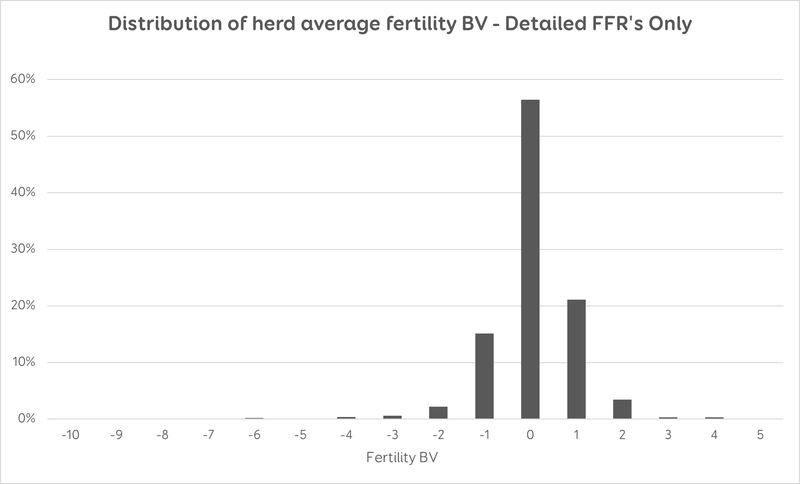
The strong influence of management on herd reproduction results is why we see a wide variation in herd reproductive performance across the country (Graph 4) despite there being little variation in the herd average fertility BV across the herds in NZ (Graph 5).
We are not, however, saying that genetics are not important!
The gains from lifting a herd’s average Fertility BV are cumulative and permanent. If you are using our bull teams, you will automatically be breeding from bull teams that deliver Fertility BV averages in the top 15% on farm, which will help continue improving your herd’s average fertility BV. In addition, DairyNZ’s work on cow fertility genetics aims to improve the heritability of the Fertility BV, by discovering genomic markers that could potentially be identified earlier in an animal’s life which would mean that in the future we will get faster gains in herd reproductive performance through selectively breeding for animals with higher Fertility BV.
What we do want you to keep in mind is that it can take many seasons to achieve change through genetic gain alone. In the short term, herd management can have the greatest impact on your herd’s reproductive performance. This is great as it means there is a lot you can do to positively influence your herd’s reproduction results right now.
For more information on this article, or to discuss any other reproduction questions you have, please contact the Repro team at [email protected].
1Heritability explains the degree to which genetics control the expression of a trait (e.g. high milk fat vs low milk fat percentage) rather than environmental factors. Heritability is expressed as a percentage. The closer to 100% heritability a trait has means the higher the proportion of the expression of the trait is controlled by genetics.
2All AE enrolled bulls from all semen companies with 70 or more daughters in their proof, based on the NZAEL BW Bull File downloaded from the DairyNZ website February 2020.
3Data from the TOP and production BV analysis publication produced by NZAEL. The data is from all cows in New Zealand across all breed companies.