A quick history re-cap
LIC, with support from industry experts, initially developed and launched Breeding Worth (BW), Production Worth (PW) and Lactation Worth (LW) to farmers in 1996.
When LIC became a farmer-owned co-operative in 2002, sire BW was passed to DairyNZ but LIC retained ownership of cow BW, PW and LW.
Following the development of the Dairy Industry Good Animal Database (DIGAD), Animal Evaluation for the industry was transitioned to NZ Animal Evaluation, a wholly owned subsidiary of DairyNZ.
NZ Animal Evaluation are responsible for sire BW and determining the traits included. If an update is made to sire BW, the same update is applied to cow BW.
A cow’s LIC gBW is based on ancestry, individual and offspring records, as well as genomic information. A bull’s BW is based on ancestry and genomic information, until it has daughters with records. BW incorporates ten breeding value (BV) traits. These traits have been recognised as having the greatest impact on farmer profitability. It is comparable across all herds, ages and breeds.
A cow with a BW of 110 indicates the cow is expected to breed daughters that are $55 more profitable, per year, per unit of feed, than daughters of a cow with a BW of 0.
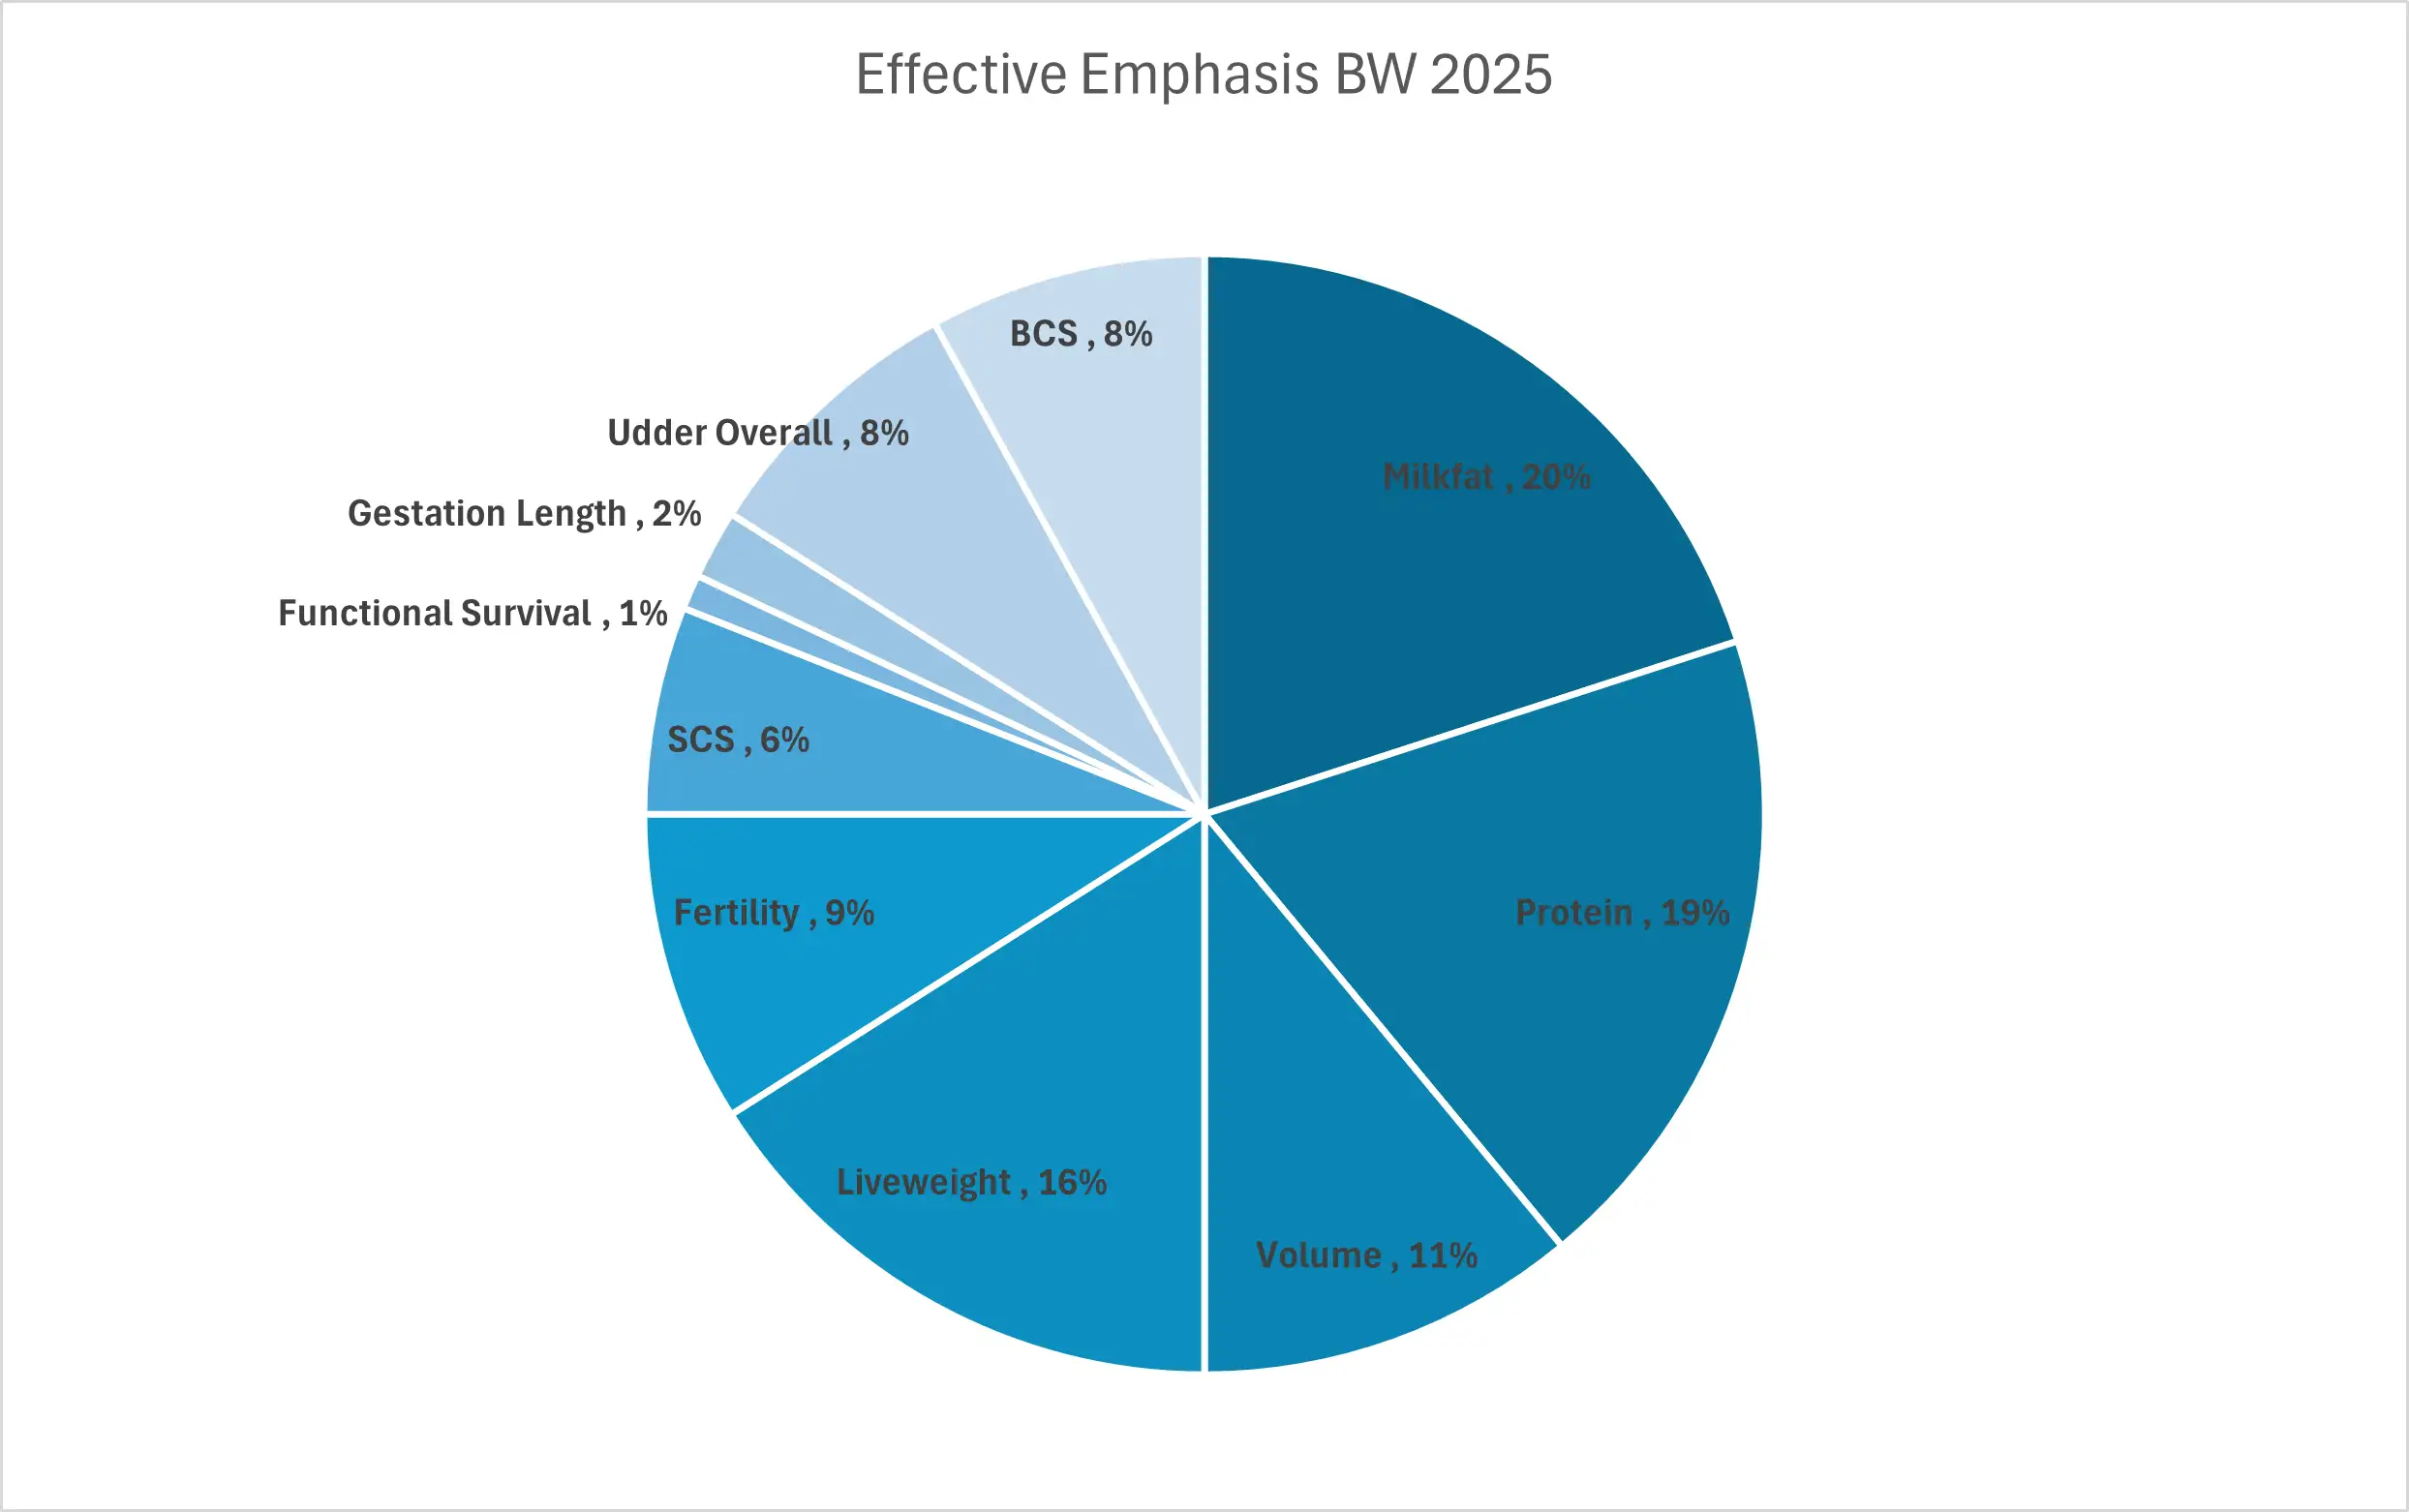
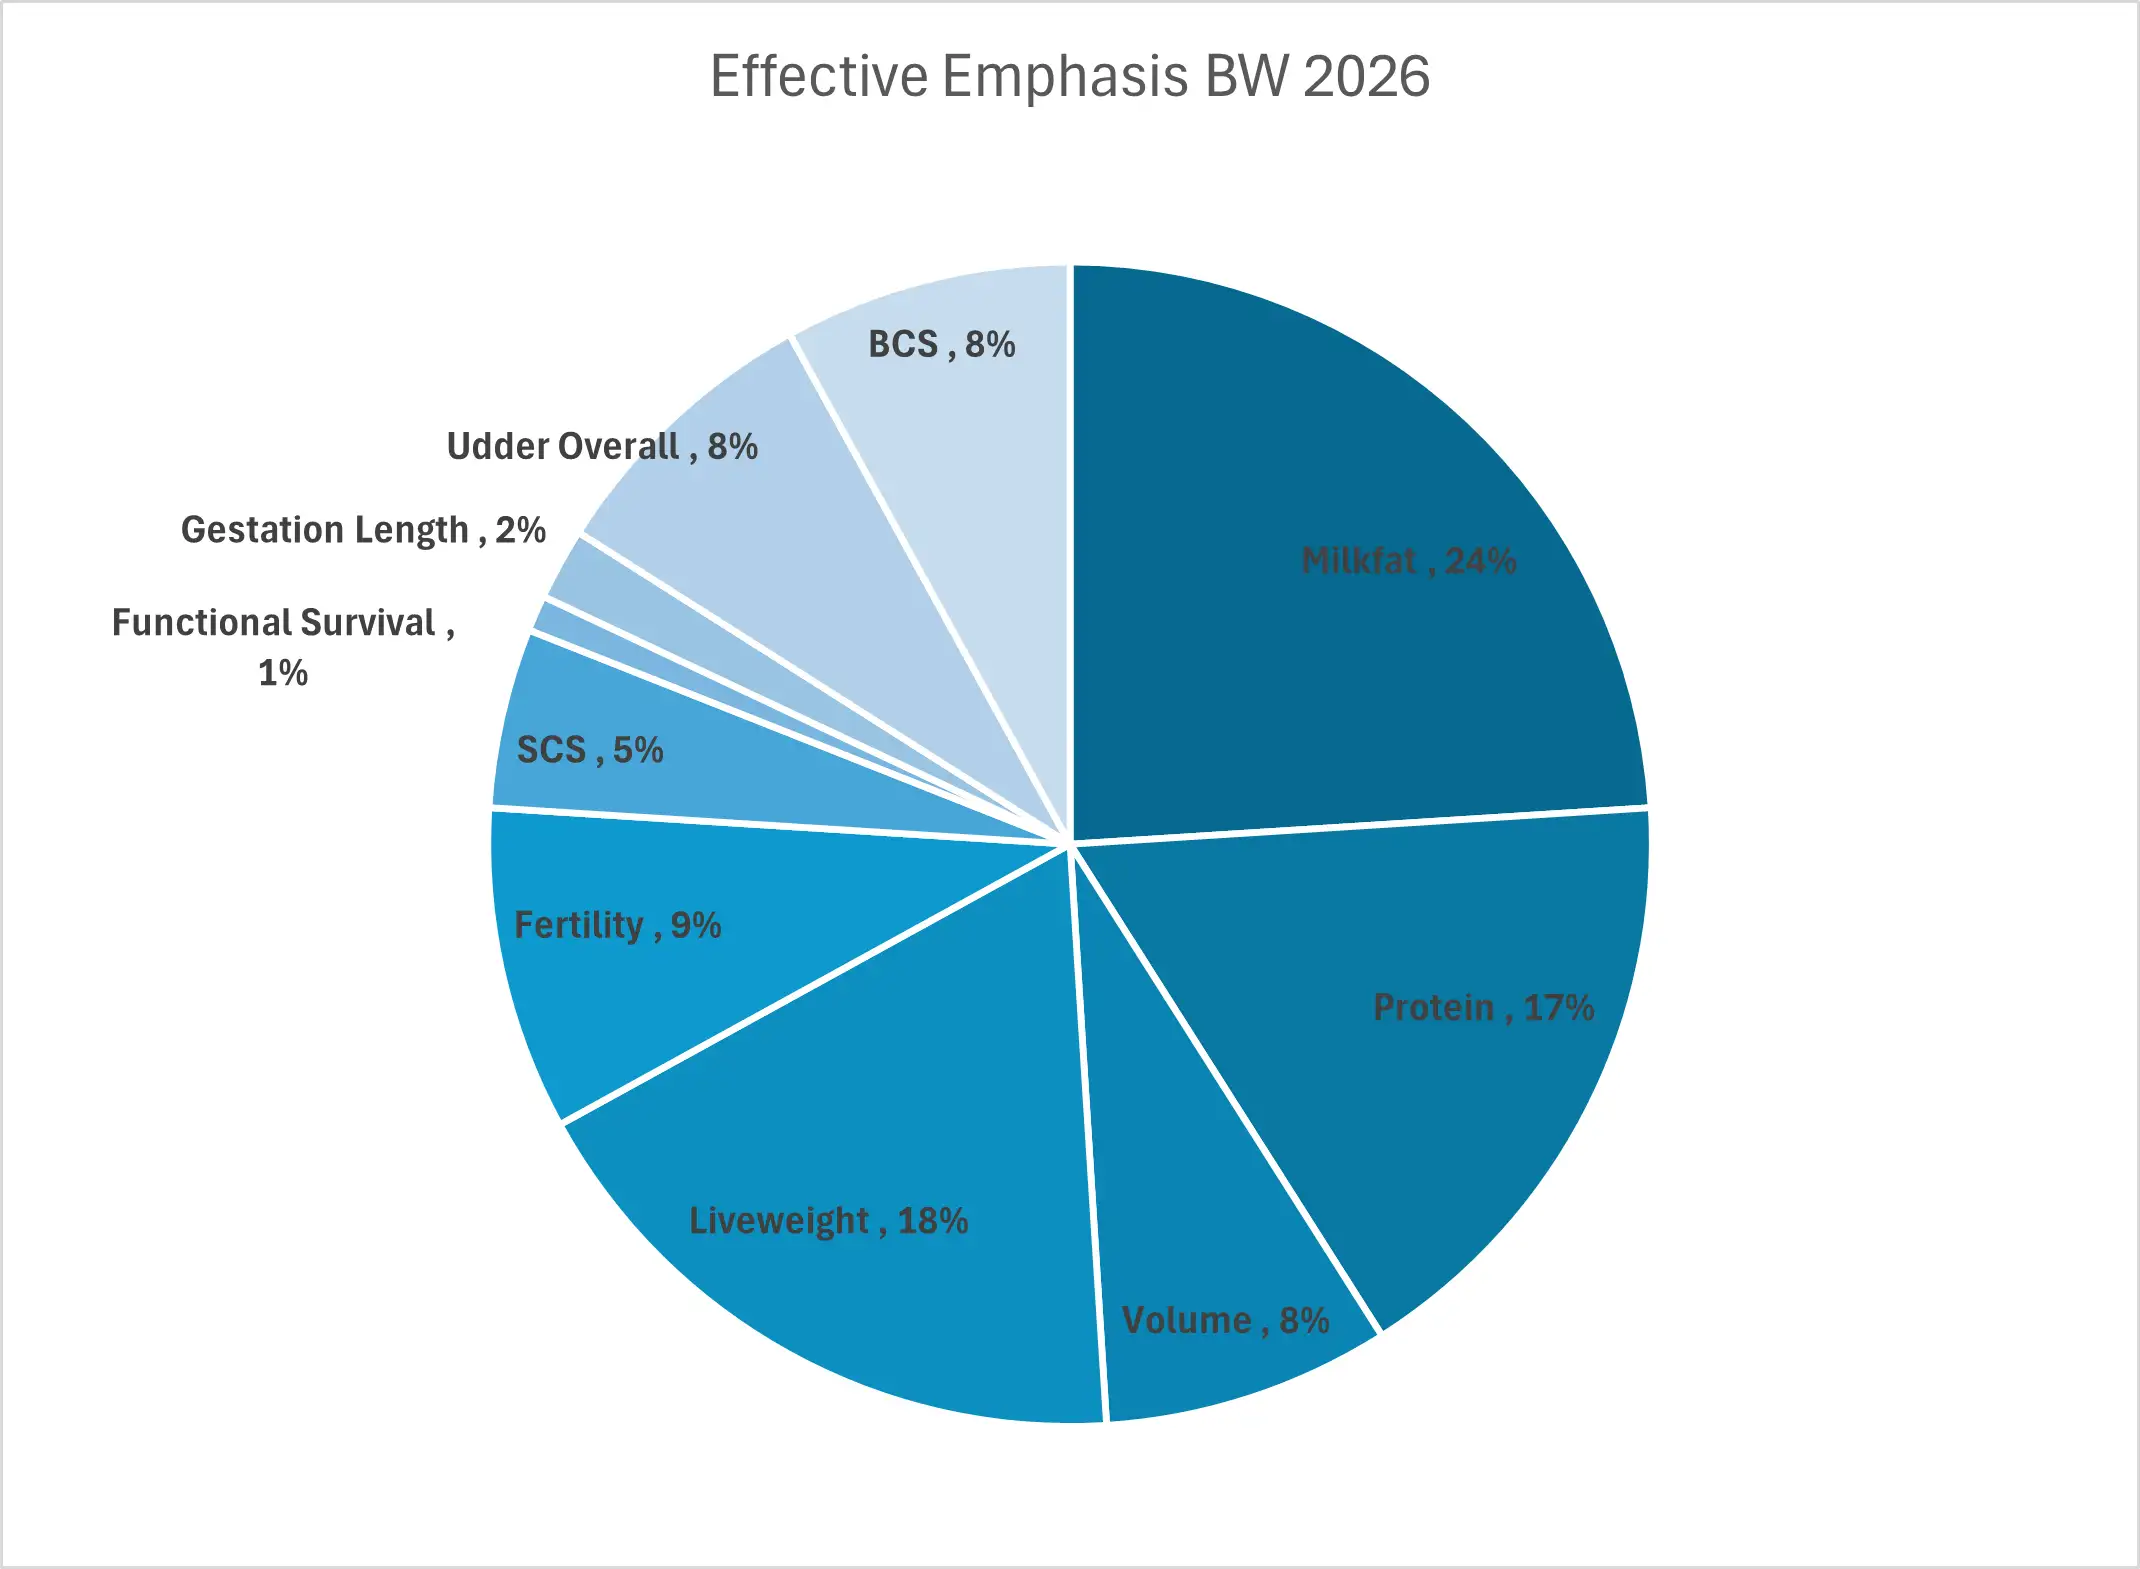
Change in emphasis on the individual traits within Breeding Worth between 2025 and 2026:
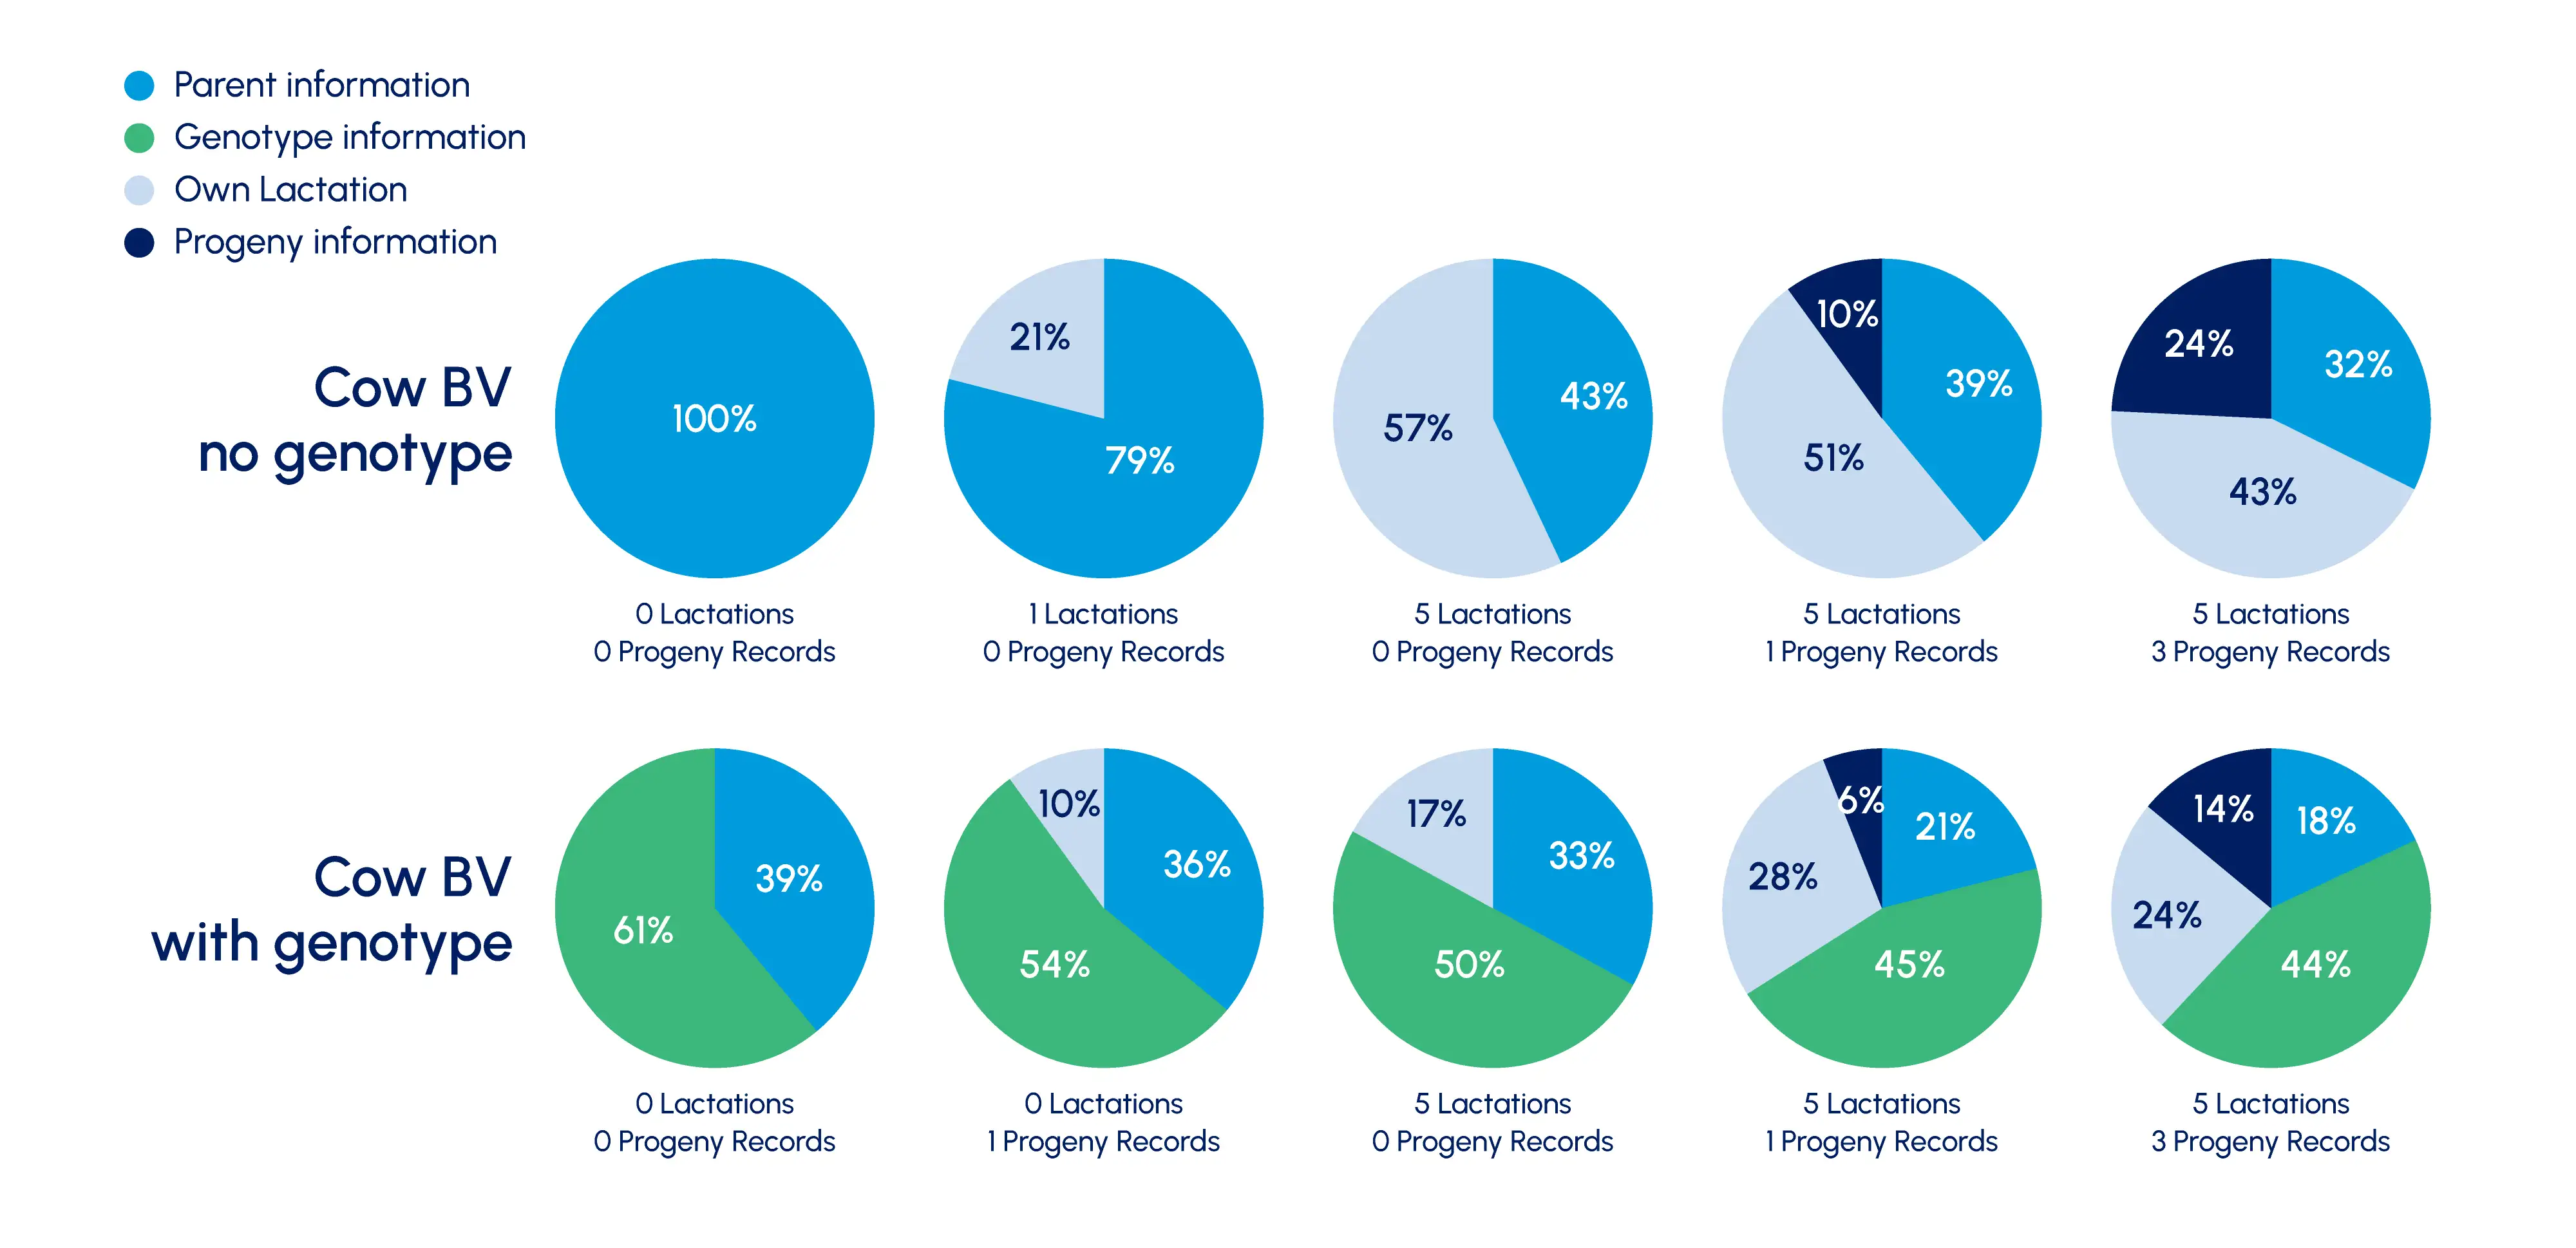
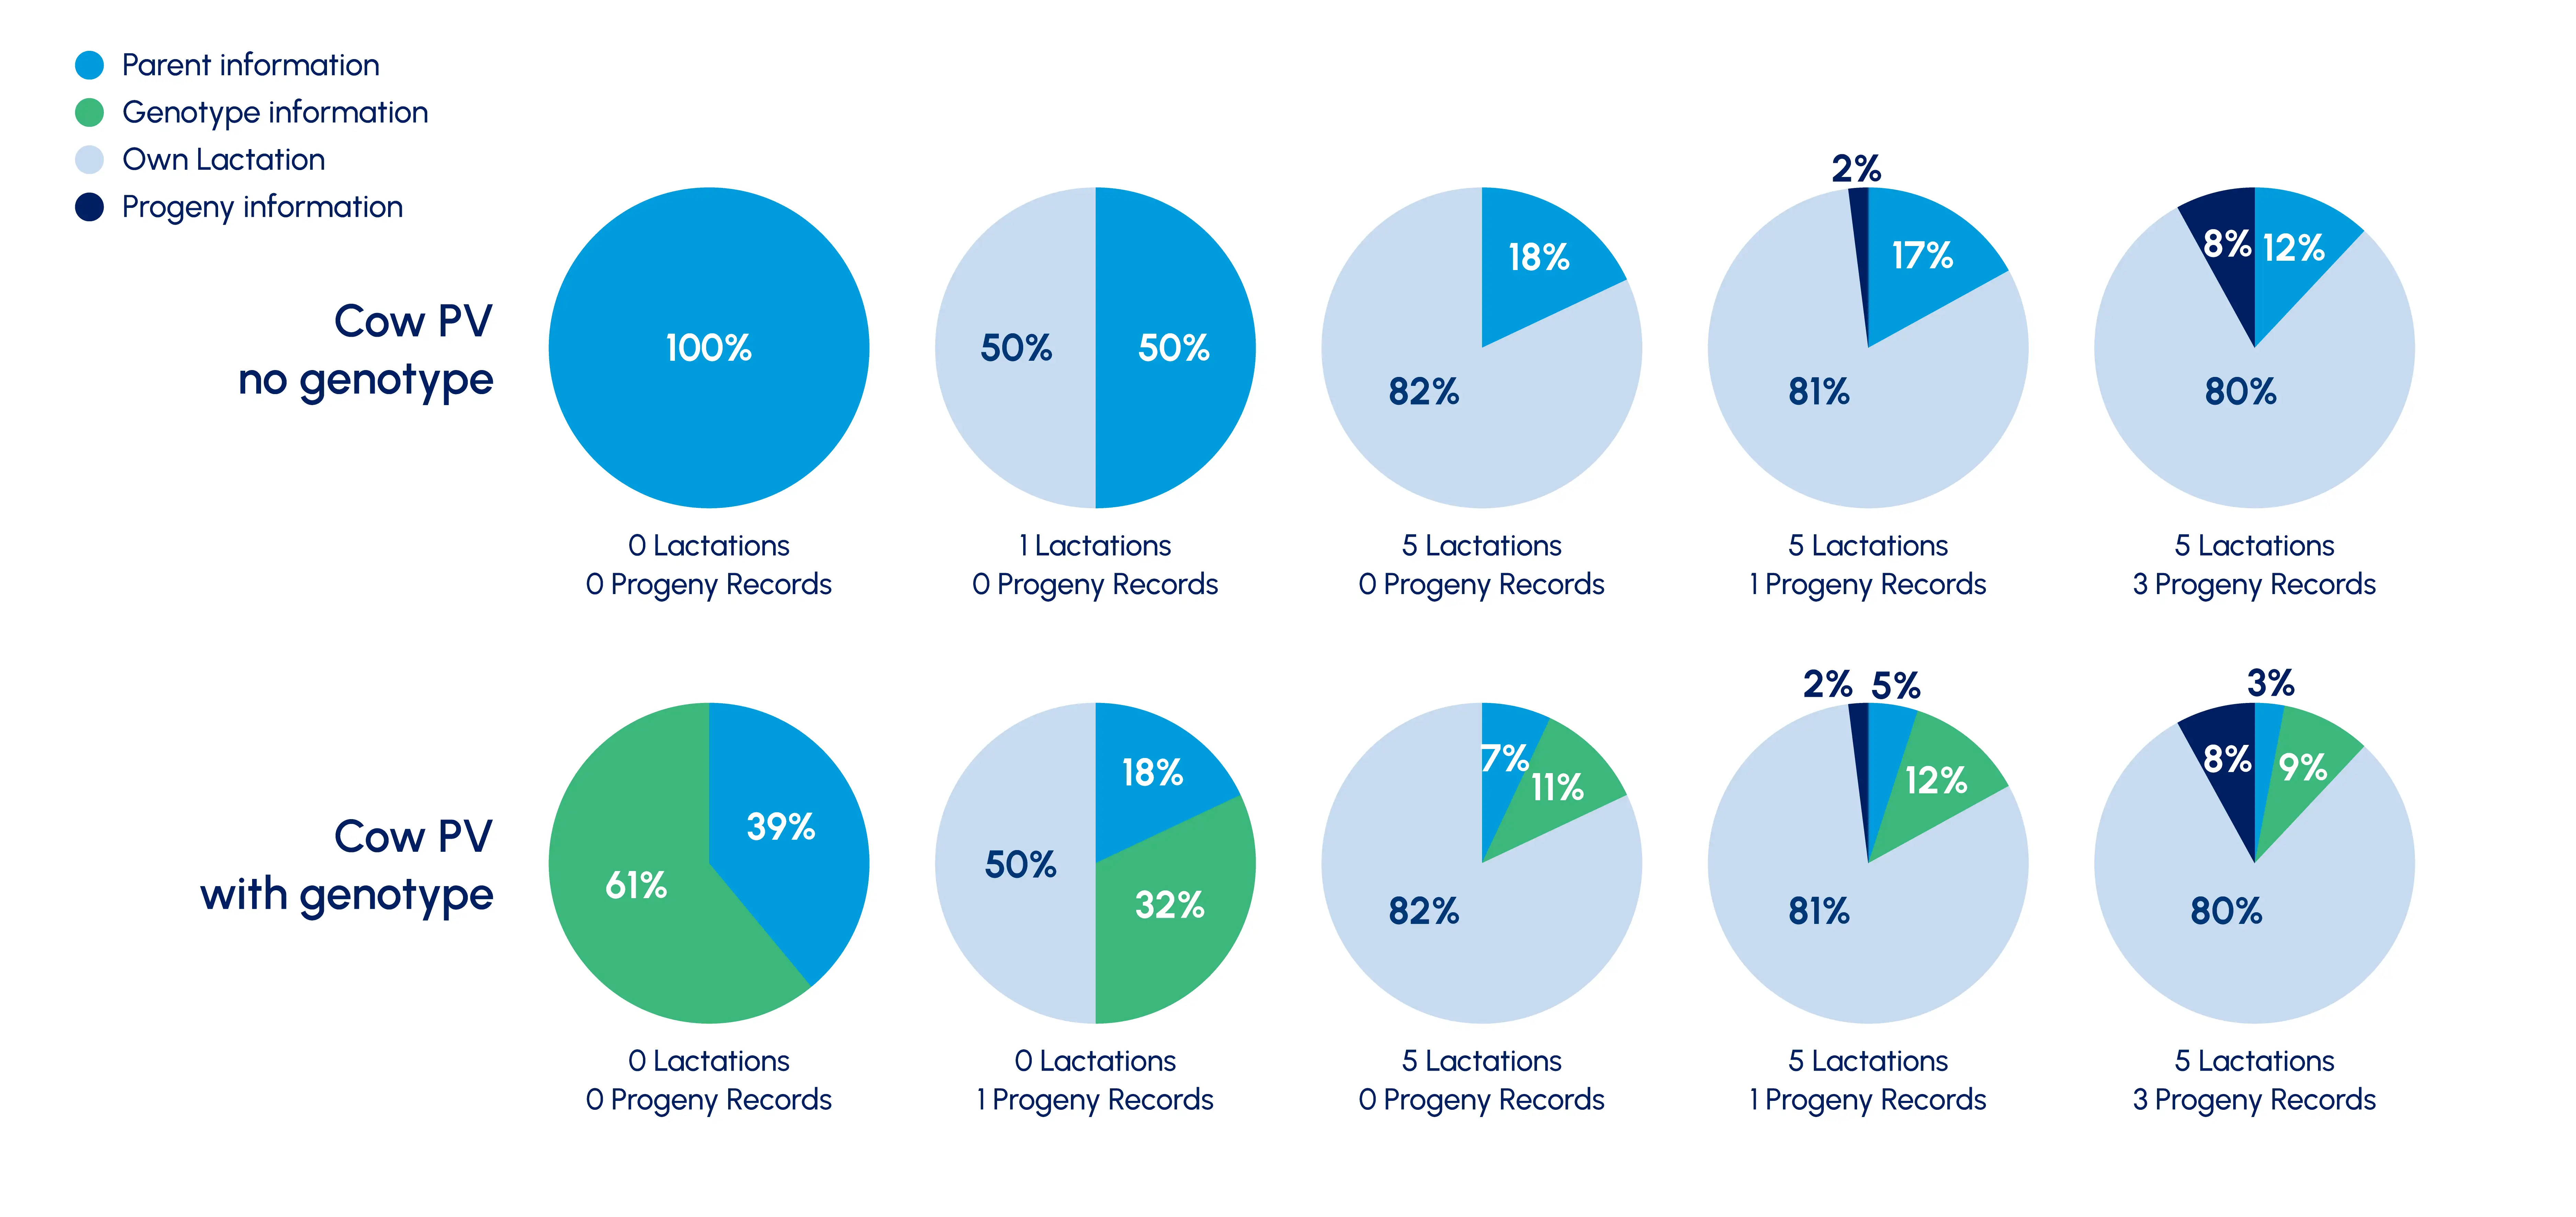
The diagram below shows the weight of a cow’s BVs at different stages of her herd life.
Ancestry/own lactation/progeny information weighting in cow BV
It combines genetic potential with permanent effects to measure cow performance. Permanent effects are lifelong factors, like early health incidences and hybrid vigour, that impact the animal’s performance throughout her life but are not inherited by offspring. Hybrid vigour occurs when animals from different breeds are crossed, resulting in crossbred animals that, on average, perform better than what would be expected from the average of their parent breeds. Within the Animal Evaluation (AE) system, the effects of hybrid vigour on milkfat, milk yield and liveweight are accounted for in each cows PV’s and PW estimates.
Like cow BW, PW (and PVs) is also based on ancestry, genomics (if available), individual and offspring records. Cows are given PVs for five individual traits:
- protein
- fat
- volume
- liveweight
- somatic cell.
These are then combined into a PW using EVs.
A cow with a PW of 98 indicates the cow is expected to generate $98 more profit in each of her lactations, than a cow with a PW of 0.
The weighting placed on a cow’s own records is much greater than those for ancestry and offspring when calculating PVs (see the diagram below). This is because PVs/PW measure the lifetime producing ability of the cow herself, not what she is expected to pass on to offspring. It's important to note, herd test records collected on animals eight years or older don’t feed into the PW estimate. If a cow is still in the herd at this age, she has already justified her presence in the herd. This herd test information does however feed into her LW.
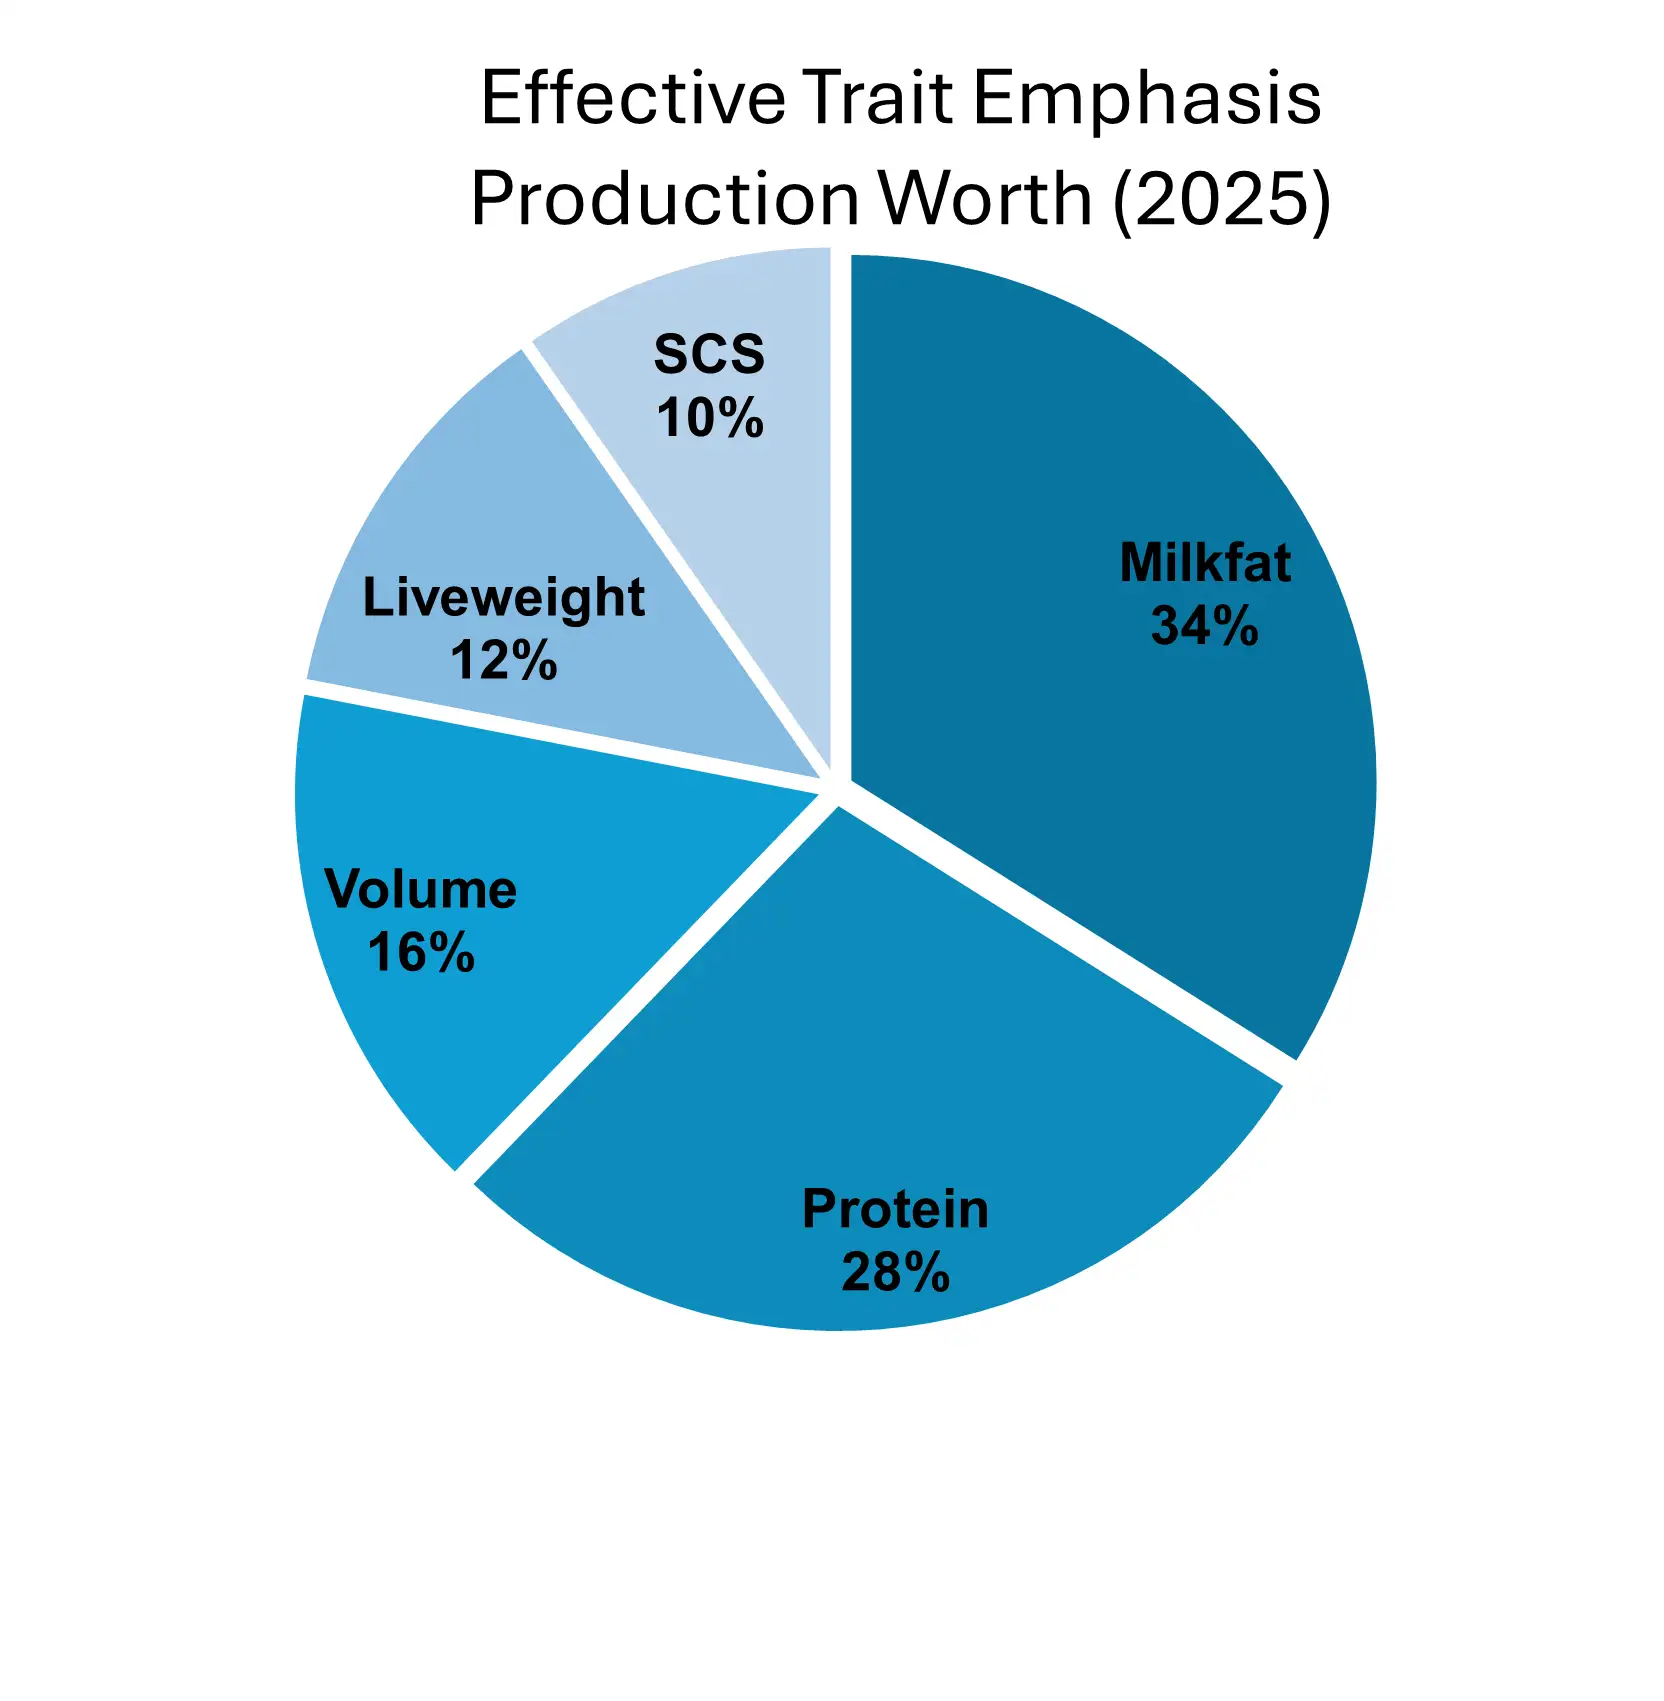
Change in emphasis on the individual traits within Production Worth between 2025 and 2026:
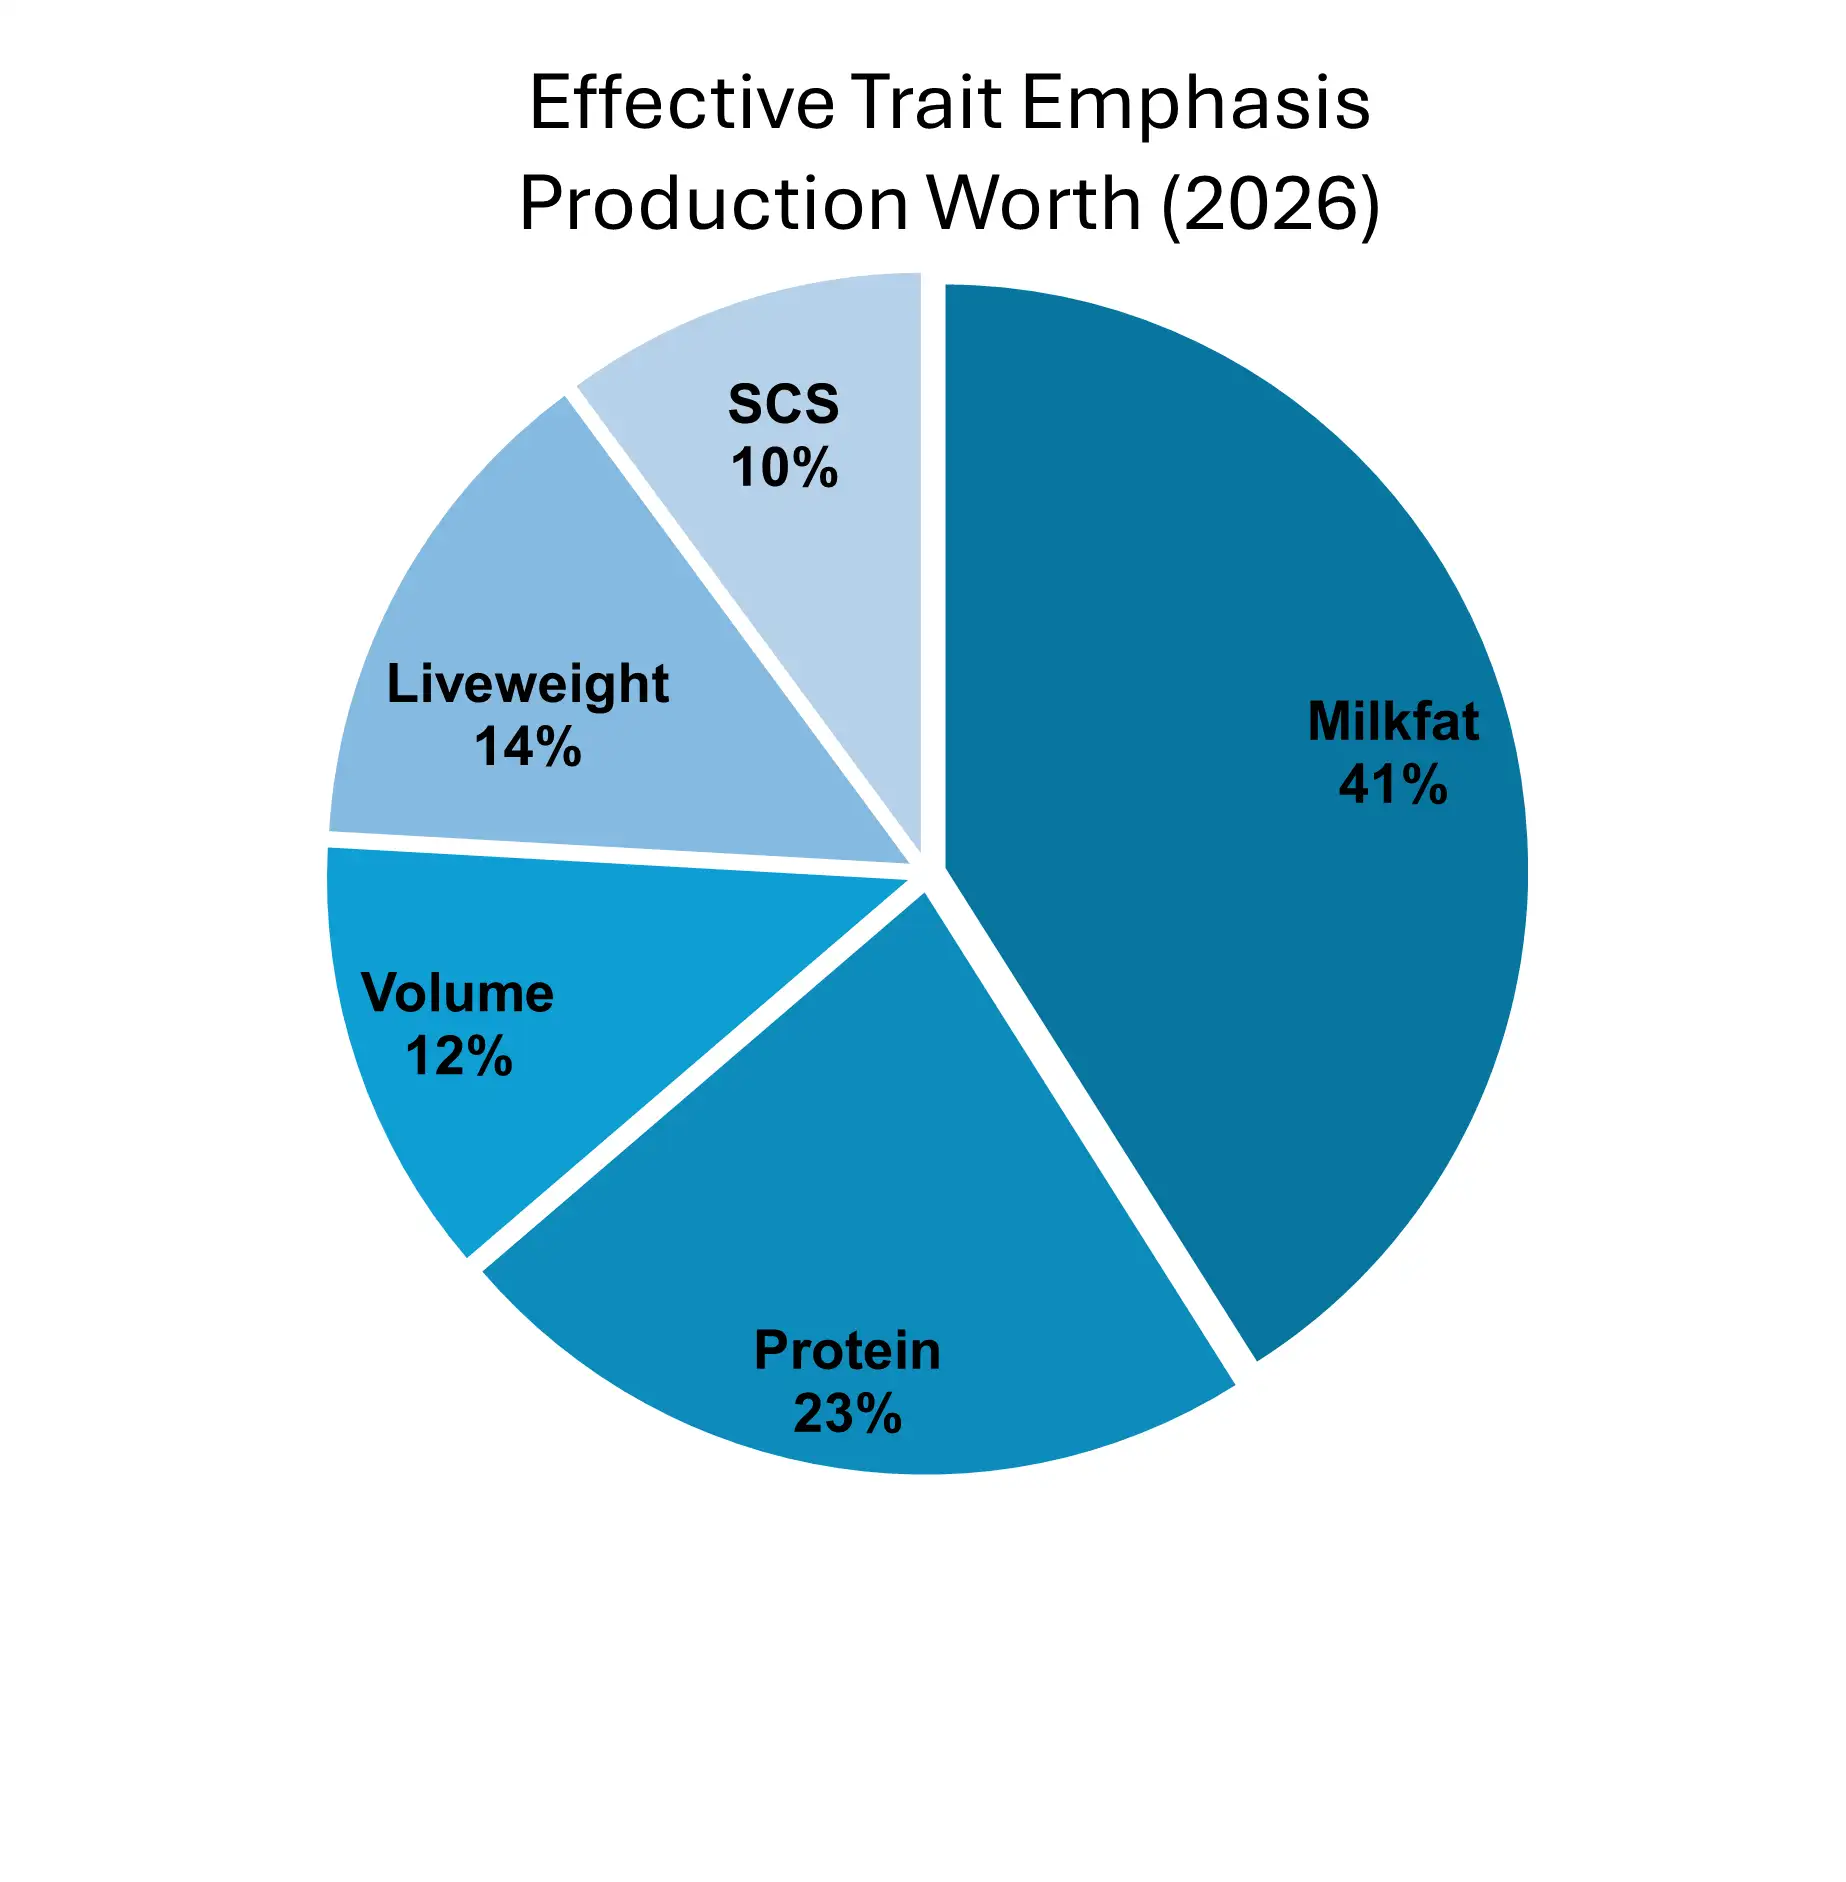
PW is comparable across all herds, ages and breeds. It’s designed to provide an accurate and objective calculation to aid farmers’ decisions related to culling and buying dairy cows.
A cow’s LW combines her current-season producing ability for:
- protein
- fat
- milk volume
- liveweight.
LW is based on a cow’s own herd test records and liveweight measurements.
A cow with an LW of 140 indicates the cow is expected to generate $140 more profit than a cow with an LW of 0. This is per unit of feed in the current season.
EVs for LW are same as those used for PW.
LW is comparable across all herds, ages and breeds. However, since LVs and LWs provide only a current season ranking of a cow’s profit and efficiency (rather than a lifetime ranking), their utility is limited for long-term decision-making. Where LW useful for assessing the performance of older cows in the herd, once a cow reaches eight years of age, herd test information no longer contributes to the estimate of PW, but is still used in the estimate of LW. A drop in LW from one season to the next could indicate that a cow is potentially past her prime.
Economic values are applied on a ‘profit per unit’ basis. For example, one additional kg of protein (in BW) creates $6.38 of additional profit for a dairy farmer.
Calculations account for milk production, historical and current milk prices, income from culls, surplus animals and bobbies, the cost of generating replacements and general dairy farm expenses.
EVs are recalculated annually to reflect changes in these values, ensuring BW, PW and LW remain relevant in an ever-changing market environment.
In 2021, NZ Animal Evaluation changed the timing of annual economic value updates from February to December to align with the Interbull (international) evaluation schedule.
NZ Animal Evaluation is responsible for updating BW EVs and LIC, as the owner of PW and LW, is responsible for updating PW and LW EVs. The National Breeding Objective Economic Model is utilised across all indices to ensure the same revenue and costs are used.
In addition to the outputs of the national system, LIC operates its own genomic evaluation system. It incorporates all the same pedigree and phenotypic information as the national system, as well as incorporating genomic data. The resulting Genomic Breeding Worth (gBW) can be used as a guide for selecting a team of bulls to breed profitable and efficient replacements.
More detail on the economic model and the latest BW EVs are available on the DairyNZ website.
2026 BW EVs in comparison to 2025 BW EVs
|
Trait |
2026 EV BW |
2025 EV BW |
Change |
|---|---|---|---|
|
Milkfat (kg) |
2026 EV BW 6.38 |
2025 EV BW 5.27 |
Change 1.11 |
|
Protein (kg) |
2026 EV BW 6.38 |
2025 EV BW 7.10 |
Change -0.72 |
|
Milk Volume (L) |
2026 EV BW -0.08 |
2025 EV BW -0.12 |
Change 0.03 |
|
Liveweight (kg) |
2026 EV BW -2.01 |
2025 EV BW -1.68 |
Change -0.33 |
|
Functional Survival (%) |
2026 EV BW 1.85 |
2025 EV BW 1.90 |
Change -0.05 |
|
SCS (log cells/ml) |
2026 EV BW -47.93 |
2025 EV BW -46.43 |
Change -1.50 |
|
Fertility (%) |
2026 EV BW 6.25 |
2025 EV BW 5.90 |
Change 0.35 |
|
BCS (score) |
2026 EV BW 179.02 |
2025 EV BW 174.57 |
Change 4.45 |
|
Udder Overall |
2026 EV BW 64.56 |
2025 EV BW 60.33 |
Change 4.23 |
|
Gestation Length (d) |
2026 EV BW -2.01 |
2025 EV BW -1.95 |
Change -0.06 |
This year saw a revamped and simplified NBO from AbacusBio, alongside the annual update of on farm economic costs and revenue. The key changes this year include:
- Increase in Value Component Ratio (VRC) – impacting Fat EV
- Lactose inclusion via Milk Volume EV – impacting Volume EV
- Fonterra’s new pricing to account for lactose
- Change to feed energy requirements for milk component synthesis
- Heifer rearing cost increased from $5.50 to $13.28 per week. – impacting liveweight EV.
2026 PW EVs in comparison to 2025 PW EVs
|
Trait |
PW* EV 2026 |
PW EV 2025 |
Change |
|---|---|---|---|
|
Milkfat ($/kg) |
PW* EV 2026 6.97 |
PW EV 2025 5.82 |
Change 4.74 |
|
Milk protein ($/kg) |
PW* EV 2026 5.26 |
PW EV 2025 6.62 |
Change 7.70 |
|
Milk volume ($/L) |
PW* EV 2026 -0.09 |
PW EV 2025 -0.12 |
Change -0.10 |
|
Live weight ($/kg) |
PW* EV 2026 -1.92 |
PW EV 2025 -1.6989 |
Change -1.69 |
|
Somatic cell score ($/SCS) |
PW* EV 2026 -48.07 |
PW EV 2025 -46.50 |
Change -42.42 |
* Economic Values for Lactation Worth traits will be the same as those used for Production Worth.
The estimated average movement in PW for the different breeds (based on all current, tagged females in herd tested herds) are; Holstein-Friesian (+$1), Jersey (+$14), Holstein-Friesian x Jersey Cross (+$8).
A reliability of 0%, indicates we know nothing about the animal or any of its ancestors. A reliability of 99%, indicates we have a lot of information behind the evaluation and are confident that the variation of the gBW will be minimal.
The more ancestry information, herd test data (animals own records), and progeny information included the higher the reliability or confidence we can place on the gBW figure. DNA parentage and LIC genomics can result in a more reliable breeding value by assessing whether your animals' received genes associated with good or poor performance from their parents. It allows you to identify your best animals at a young age, with more certainty, and make more informed breeding decisions.

A cow’s BVs takes into account four types of records:
- Ancestry (all female relatives related through ancestry such as sisters and nieces) – used when she’s a calf.
- Genomic information
- Own performance (once she is milking).
- Performance of offspring (or direct descendants) – included once she has herd-tested daughters.
In absence of herd test and genomic information, an animal is evaluated solely on its ancestry records. As the number of lactations and herd tests increase, her own performance starts contributing to her BW estimate, although ancestry still plays a dominant role.
Advancements in technology allow animals to be genotyped before gaining any herd test information, improving the accuracy of the of breeding worth predictions at a much earlier age. Genomic information improves the reliability of an animal’s breeding value by including its DNA data within the genomic evaluation model.
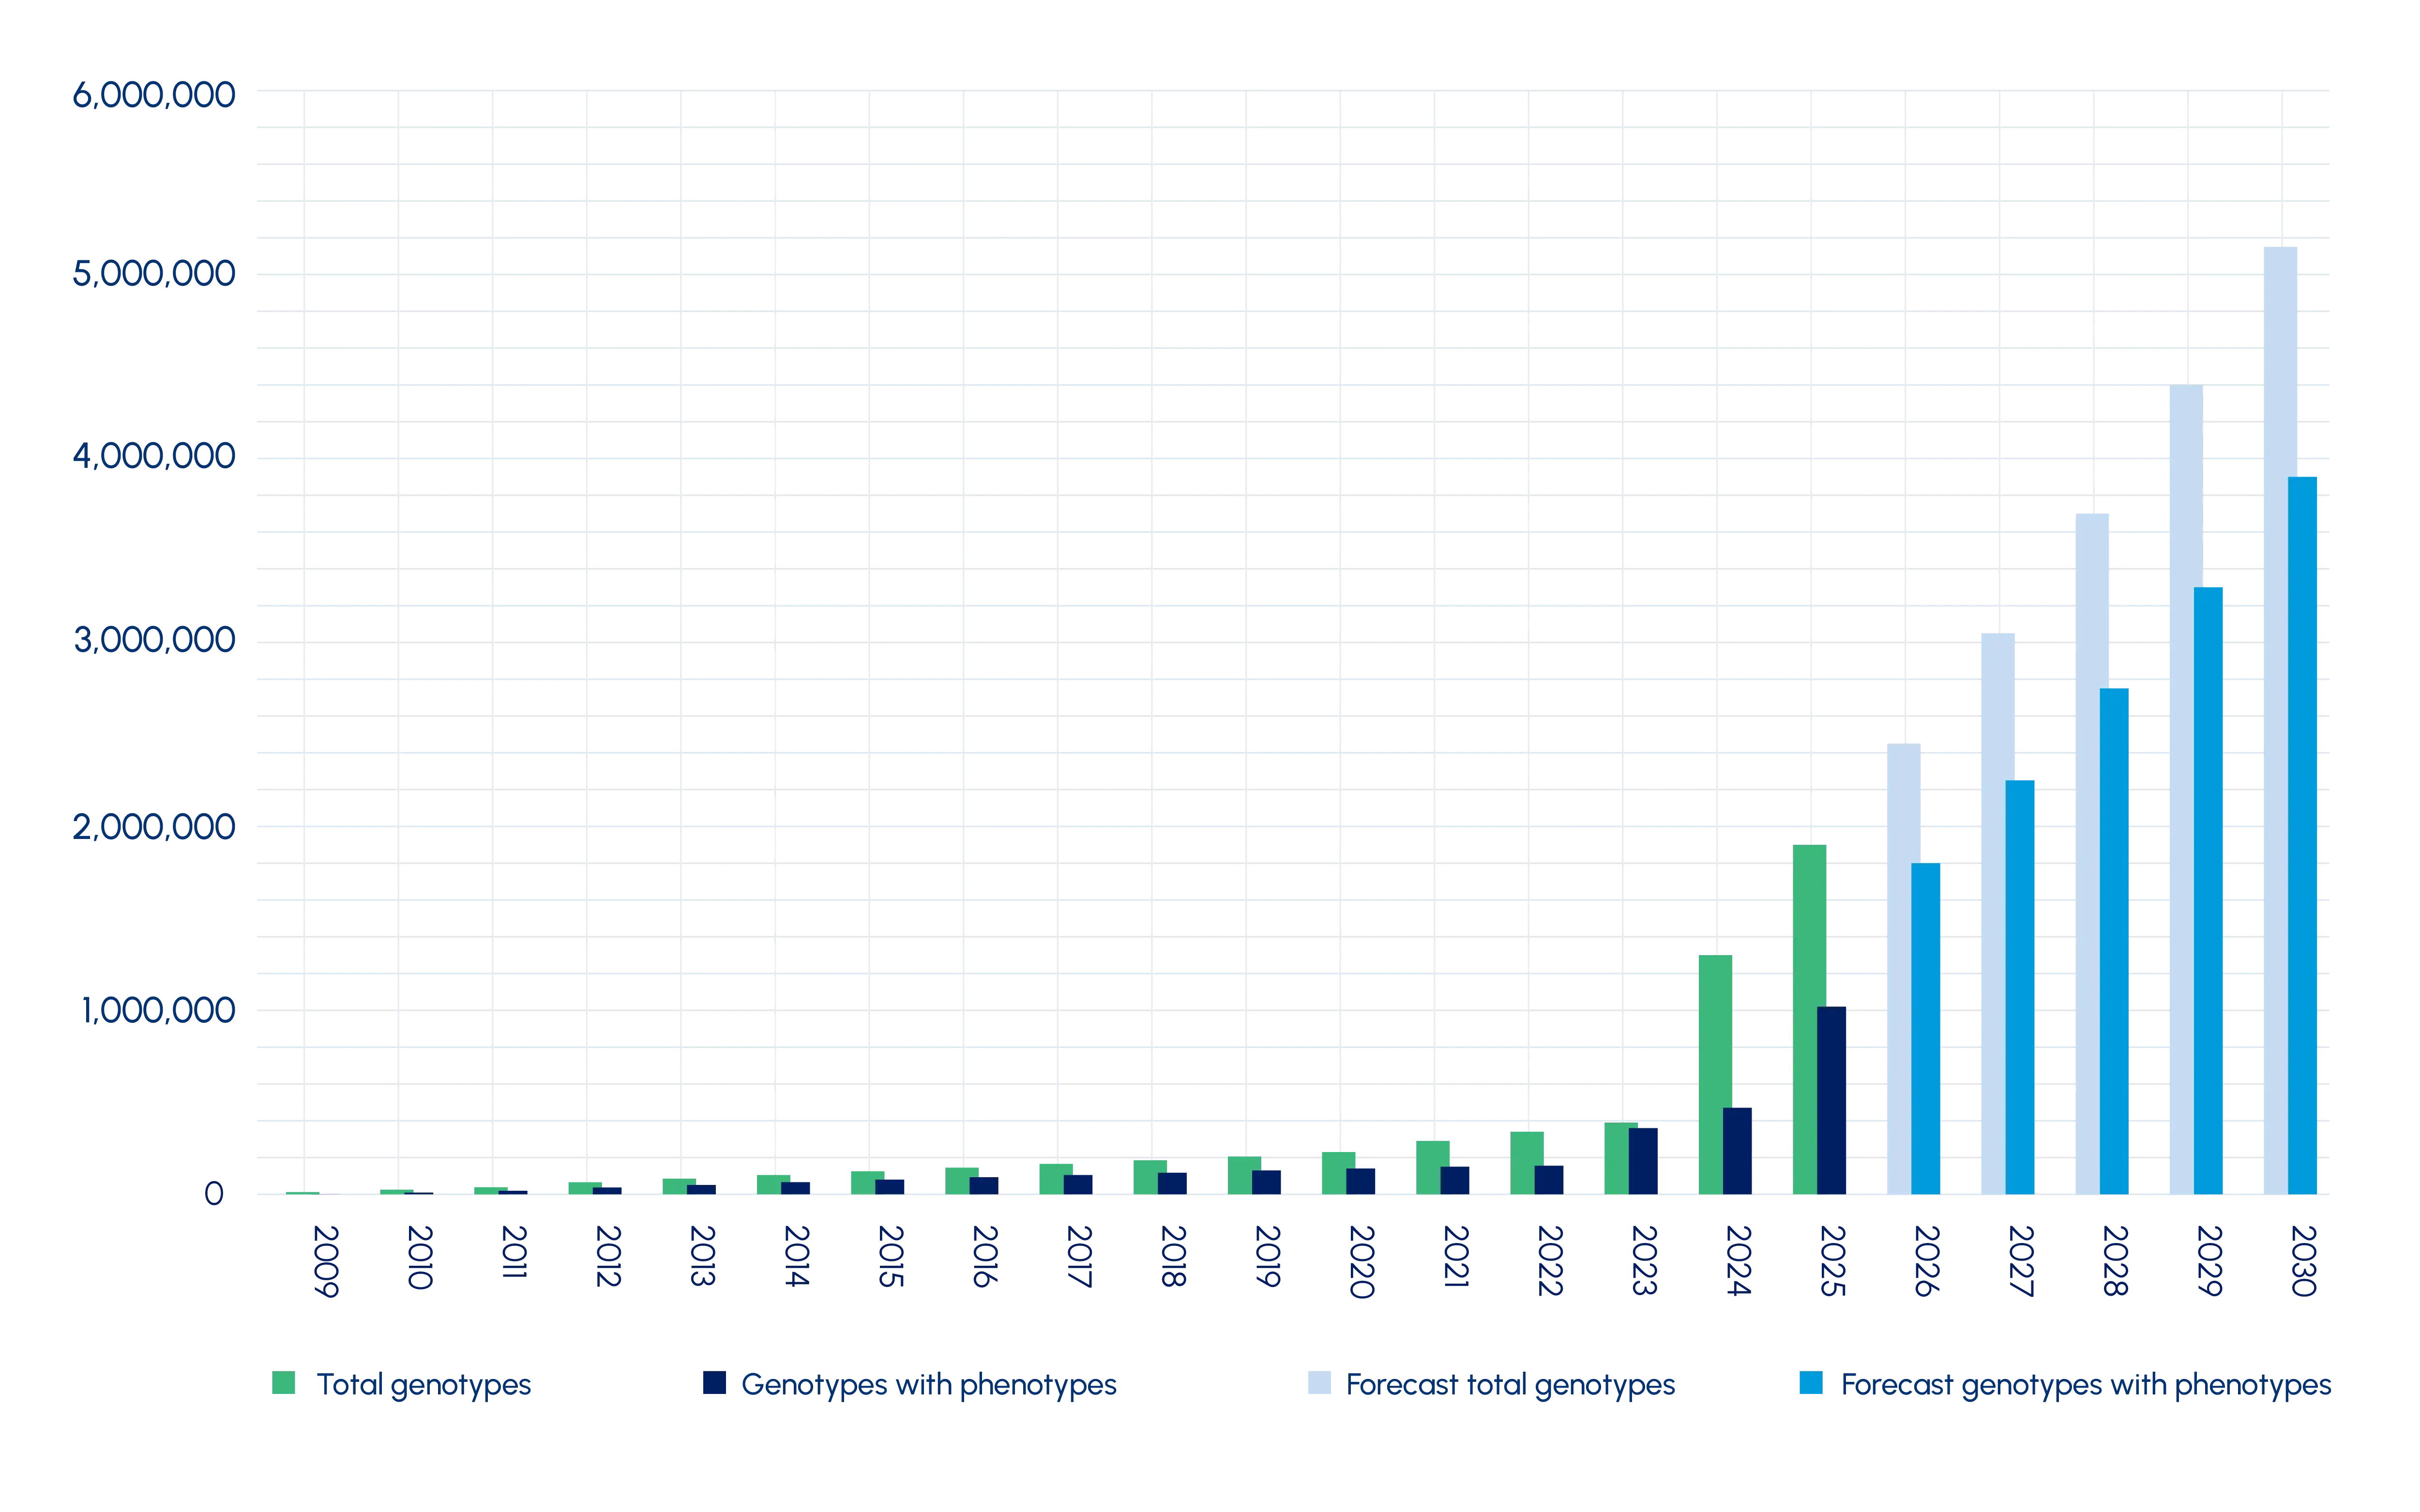
The rate at which genotypes are being collected has increased rapidly, with LIC’s reference population hitting 2 million animals in 2026. This growth is set to continue, with projections indicating 5 million genotypes by 2030, further strengthening the stability and accuracy of the LIC genomic evaluation model.
How we support NZ Animal Evaluation
We maintain a close working relationship with NZ Animal Evaluation as part of our responsibility in the ownership of cow indices. A senior LIC representative is also a member on the NZ Animal Evaluation Scientific Advisory Committee (SAC).
We also provide a range of services that help farmers capture quality on-farm data for animal evaluation by NZ Animal Evaluation:
- Artificial breeding (AB)
- Herd testing
- Herd recording (MINDA)
- Health diagnostics
- DNA parentage testing and Genomic Evaluation.
How you can help with animal evaluation
When you herd test or record animal information in MINDA®, you contribute to the NZ Animal Evaluation of those animals, their family, and their contemporary groups.
This is done by recording complete and accurate information about:
- animal ID
- calving dates
- parentage
- calving assistance
- matings
- dry off dates
- health treatments.
This data – as well as feedback from Sire Proving Scheme farmers – also help us select bulls for Premier Sires® and Alpha® teams.
More information
Learn why animal evaluations and breeding values change over time, and how those changes help deliver more accurate, reliable herd improvement decisions: Understanding data: Why changing data builds stronger herds | LIC
For help with interpreting your cow indices, contact your LIC representative.
DairyNZ provides more information about Animal Evaluation, including:
- ranking of active sires (RAS)
- herd and animal statistics
- how to interpret the breeding values and indices
- FAQs around genetic improvement.