A SPACE™ report will be sent to you within 72 hours of a clear image being captured, or at your chosen frequency when derived from the Pasture Vibe model (estimated). Cropwise Imagery is available alongside your SPACE™ reports to expand your toolkit for helping you to get even more out of your pasture.
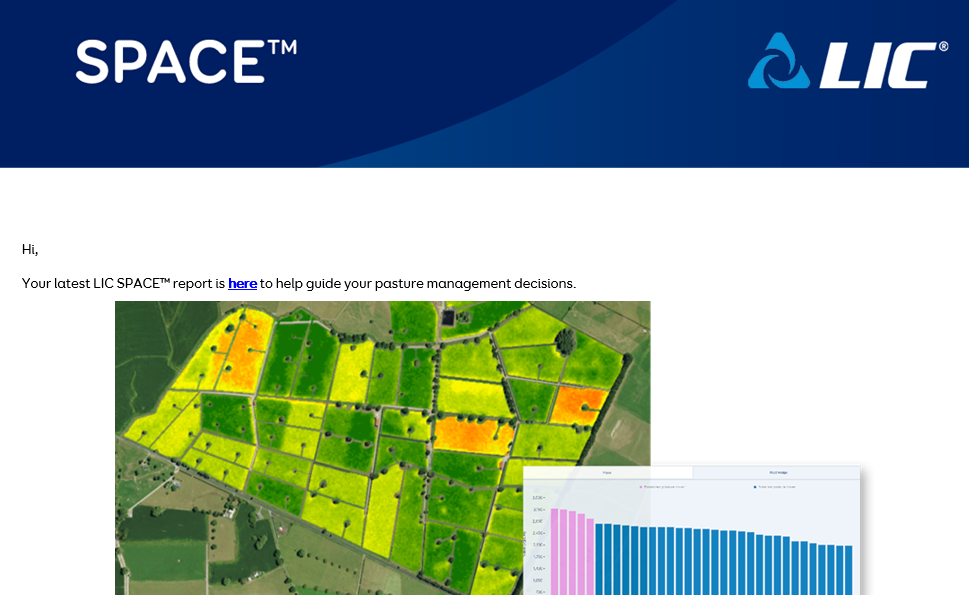
This guide will provide information about the key components of SPACE™ reports, including how to access and navigate the SPACE™ report portal, as well as sharing and updating pasture cover values.
SPACE™ reports are sent directly to your email address so that you can easily access your pasture data and analysis. Simply click the link provided in these emails to access your reports. You will be notified if your report contains pasture covers estimated using Pasture Vibe.
There isn’t a limit to the number of report recipients for your farm. We can send report emails to members of your farm team or trusted advisers at your request.
The key components of your SPACE™ reports are:
- Pasture cover variation map
- Feed wedge
- Pasture covers & paddock rankings
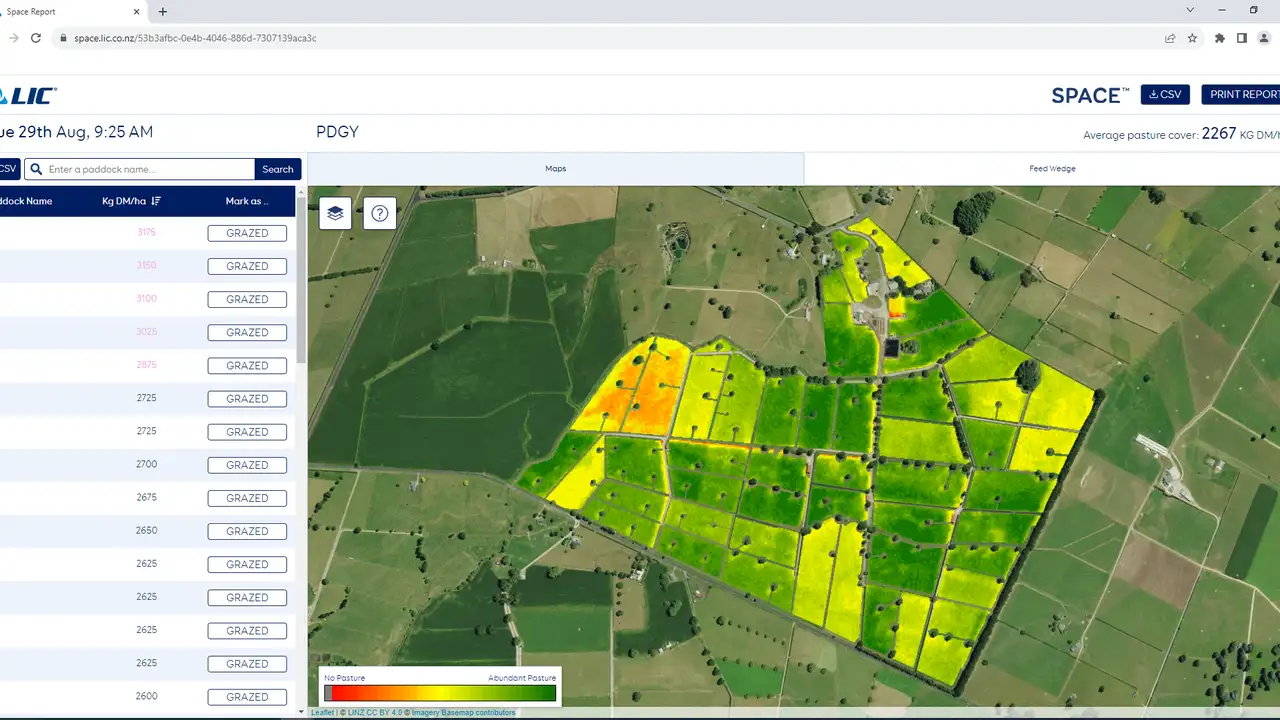
Pasture cover variation map
The Pasture Cover Variation Map presents an image of your farm showing variation in pasture cover by colour: the greener the tone, the more pasture there is, with the red-yellow tones indicating lack of pasture. The pasture map is often used by farmers to provide a quick visual overview of the pasture cover across their farm.
“It’s very useful just looking at which paddocks are deep-green and which ones are very-yellow…to see if there's any spots on the farm that are growing a bit better than expected, or that should be grazed next.” Anton, Canterbury
You can toggle between available views by selecting the Map Layers button found at the top left of the screen:
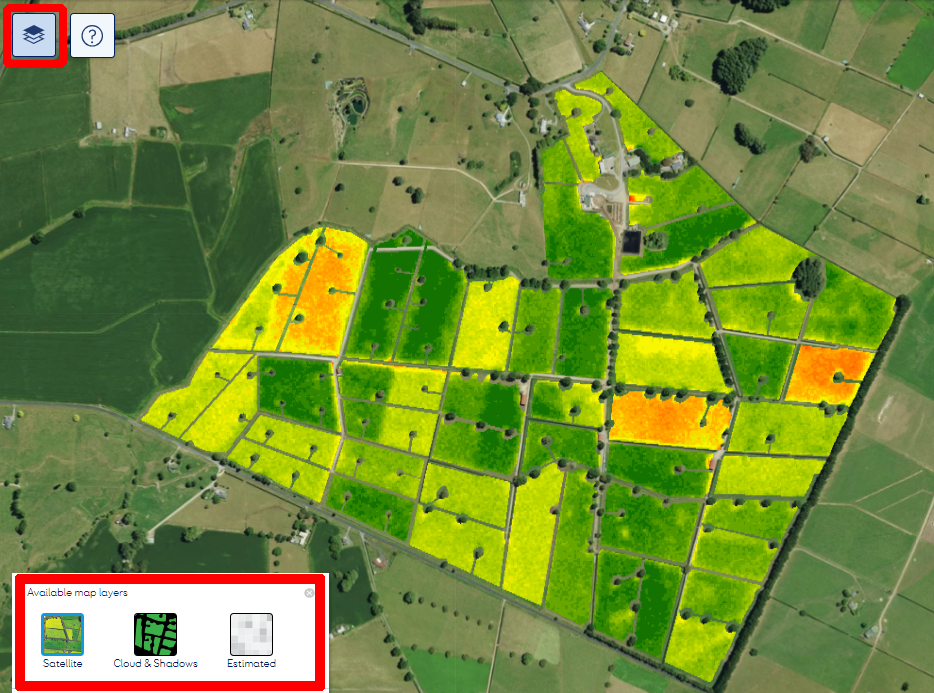
Satellite: where a clear satellite image is available.
Cloud & Shadows: identifies parts of your farm that may have been impacted by atmospheric conditions, and therefore was excluded from your pasture cover analysis.
Estimated: identifies when your whole farms pasture cover has been estimated using Pasture Vibe.
Feed Wedge
The Feed Wedge graphs paddock covers (kgDM/ha) for each paddock for your farm, sorted by paddock from the longest to the shortest pasture cover. Pre- and post-grazing targets can be set under the Feed Wedge tab to help guide pasture utilisation decisions.
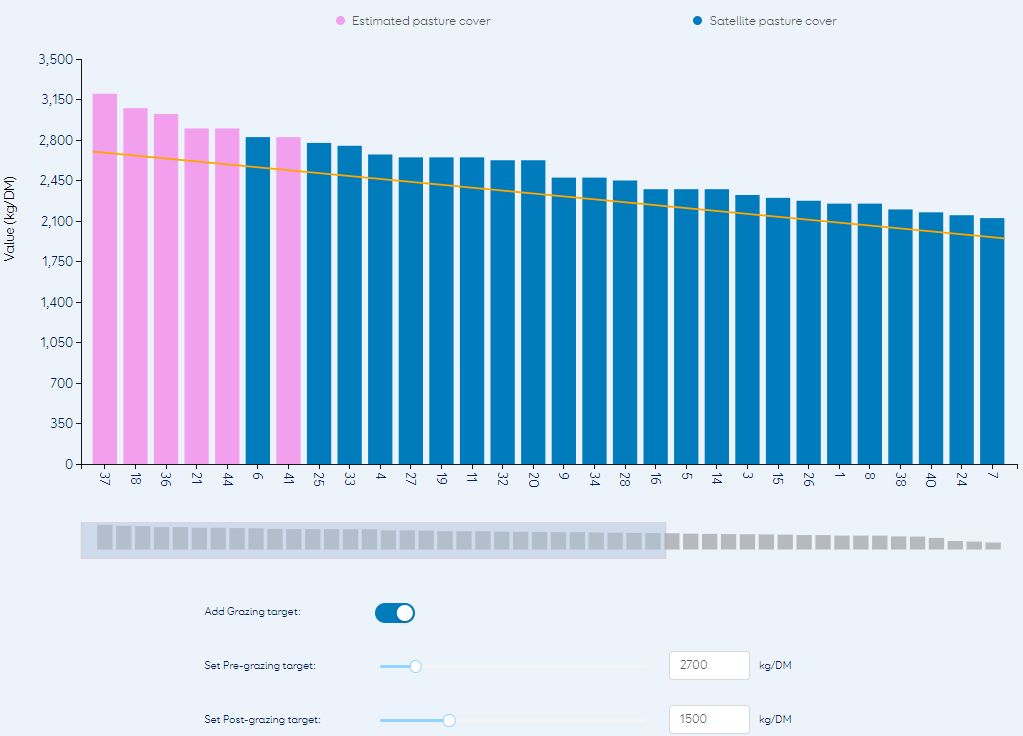
“We use the feed wedge and average pasture cover to drive our feeding decisions. It helps us identify the paddocks that are next to be grazed, while also identifying upcoming surpluses and deficits in the grazing round.” – Brendan, Tasman
Pasture covers & paddock rankings
The Paddock Covers & Rankings section lists paddocks based on decreasing estimated dry matter per hectare (kgDM/ha): the paddock with the highest amount of dry matter is listed at the top and the least amount of dry matter is listed at the bottom.
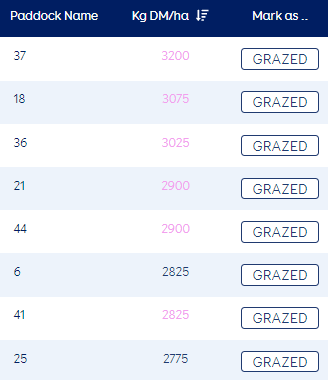
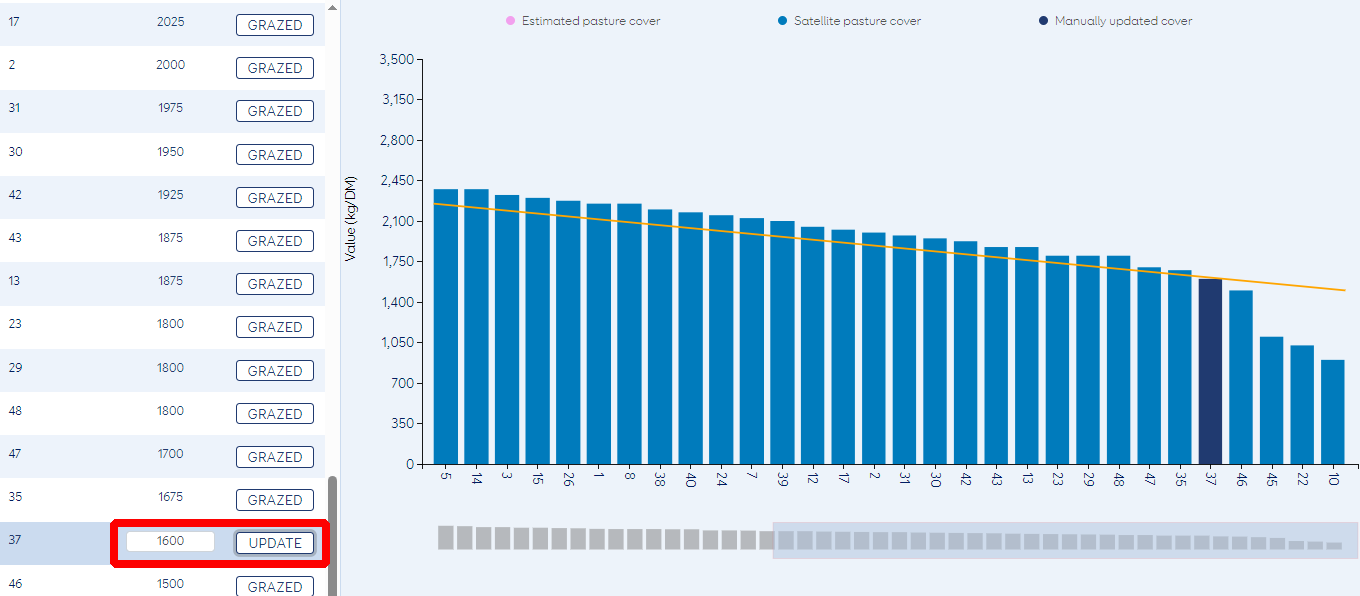
You can update the paddock covers in your report through the grazed function on your paddock rankings list. Any changes made to pasture covers will flow through to the Feed Wedge and be displayed as a dark blue bar and can be downloaded as a CSV (spreadsheet) file in Excel. Note that updates made to paddock covers are not displayed in printed SPACE™ reports.
If you wish to print your report, simply select ‘Print Report’ from the top right corner of the report window. To the left of this is a ‘CSV’ button, which allows you to download as a spreadsheet file in Excel (CSV) the estimated pasture covers for each paddock should you wish to analyse the pasture data in more detail.
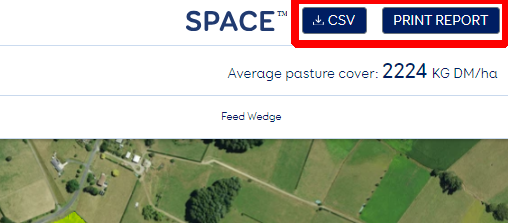
Farmers often print off their reports to display in the milking shed for the whole farm team to view and use to plan the grazing rotation or to decide where to set up electric fence breaks.