This tool is used to support strategic planning, such as pasture or paddock renovation and fertiliser application.
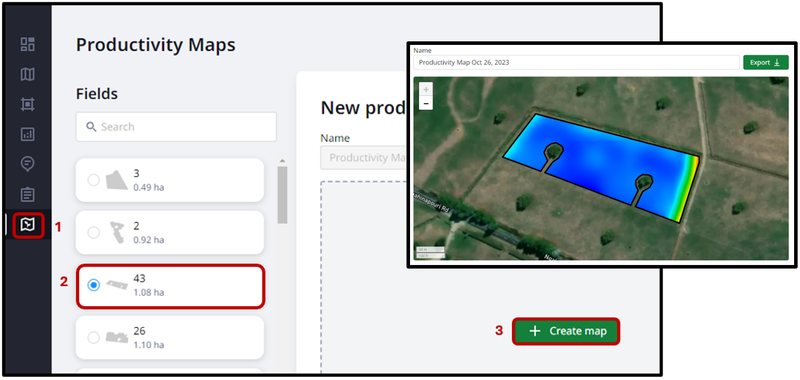
- Select the Productivity Maps menu.
- Choose your paddock of interest.
- Click ‘+ Create map’.
A map displaying the different productivity zones within the paddock will be automatically generated and can be downloaded by clicking the ‘Export’ button.
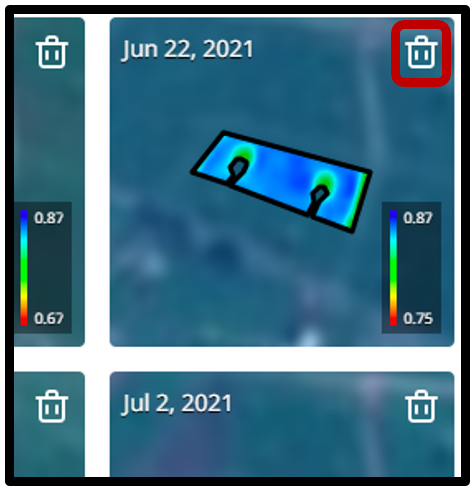
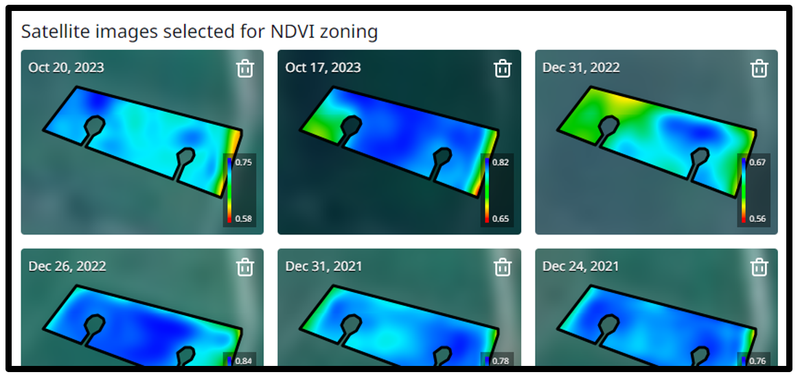
Below the primary paddock image are the individual satellite images that contributed to the analysis, as shown below, with the date of the image clearly displayed in the top left-corner of each.
After reviewing the component images, you may wish to add or delete images that have been included in the analysis.
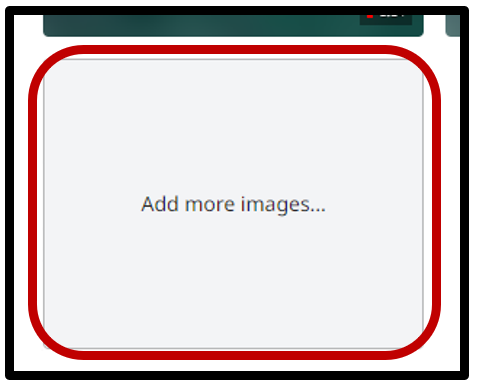
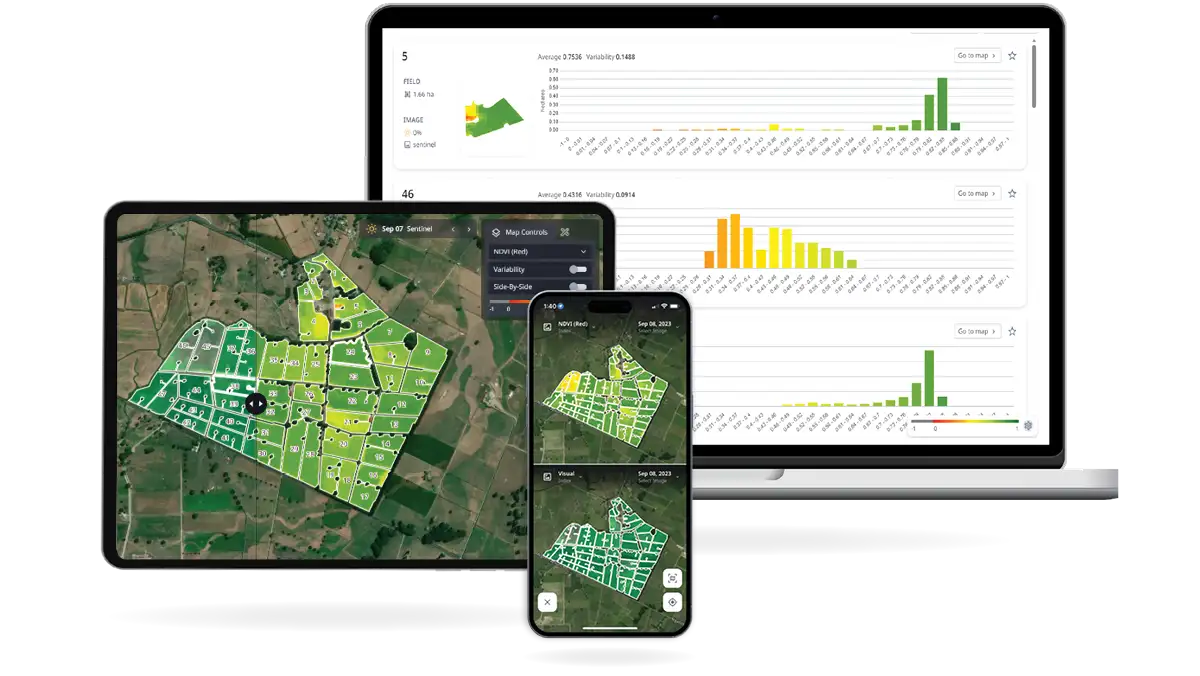
To add an image, select the ‘Add more images...’ box, which is located below the component satellite images. This will direct you to a menu with alternative image options, and which presents both the Visual and NDVI view of the paddock to ensure appropriate image selection.
If you wish to remove an image that has been selected or added, click the rubbish bin icon displayed at the top-right corner of the image.