Not only can you view all available satellite imagery for your farm, you can also use map tools to identify where break-feed should be located or identify coordinates of paddock features that you’d like to investigate further, for example.
To begin viewing satellite imagery for your farm, choose an image from the image catalogue dropdown. Each image will display one of three cloud presence icons to provide an indication of potential cloud impact:

Satellite images are distinguished by satellite type. The LIC SPACE™ service provides access to Sentinel and Planet imagery. Not all sources may be available for selection for your farm based on satellite pathing. Landsat and Drone sources are not available at present.
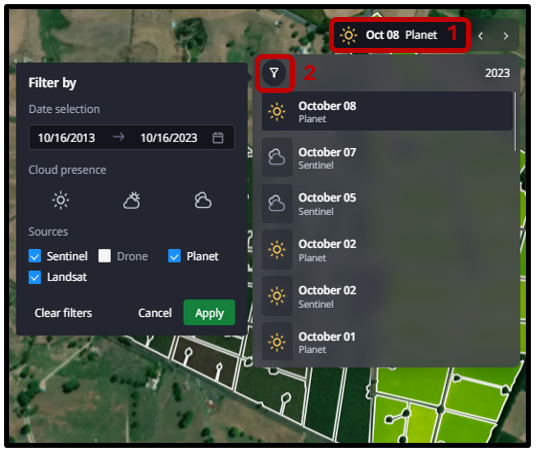
Images can be filtered based on date selection, cloud presence and sources.
- Select satellite image menu .
- Click on the filter icon to open the filter menu.
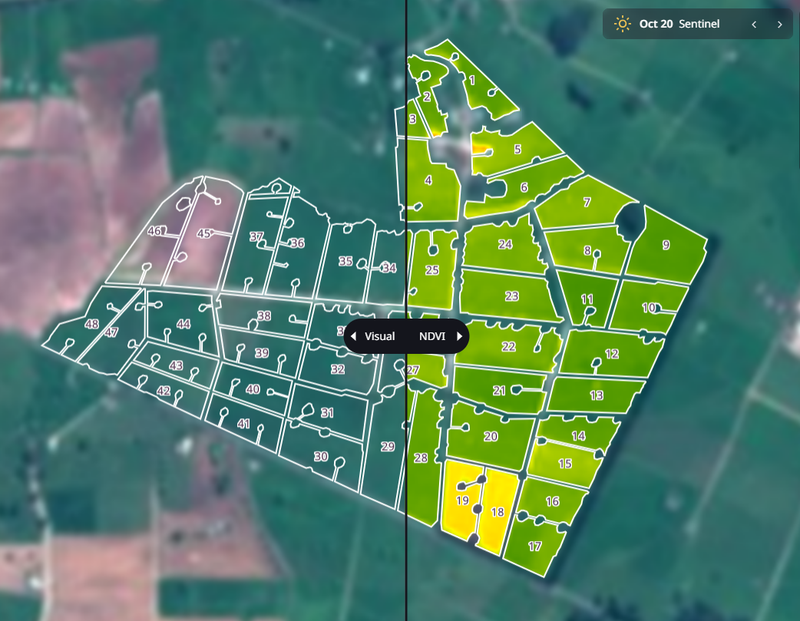
Images are distinguished by satellite type and are labelled either ‘Sentinel’ or ‘Planet’.
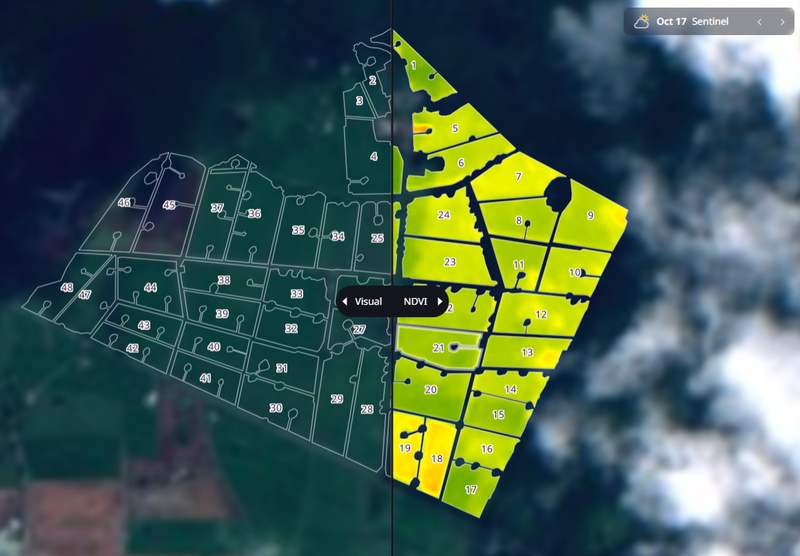
Selecting Sentinel images will show a visual tile in the background of your farm, showing atmospheric impact immediately beyond your farm boundary.
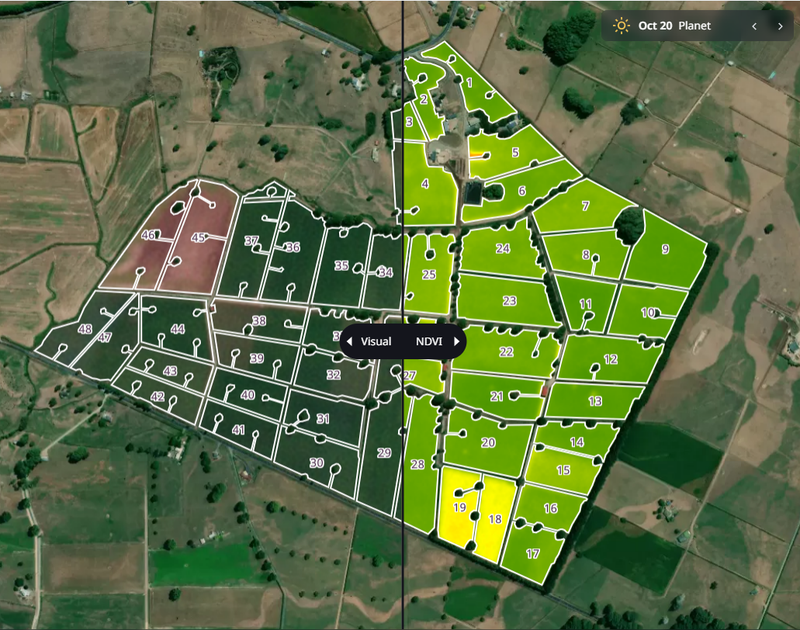
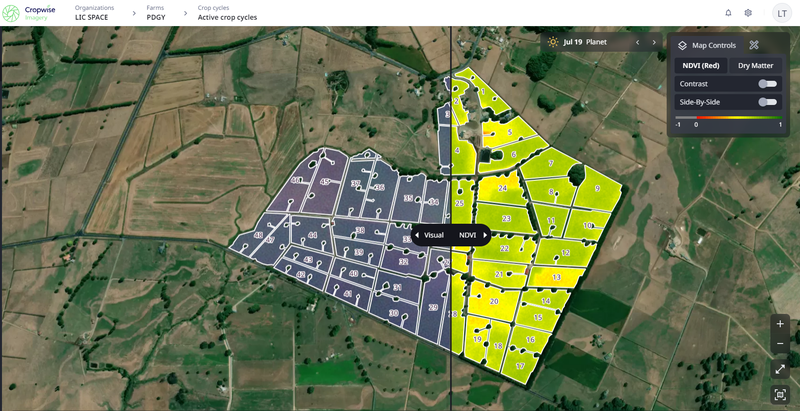
Selecting for Planet images will show a template background visual image, with any atmospheric impact displayed within the paddock boundary lines.
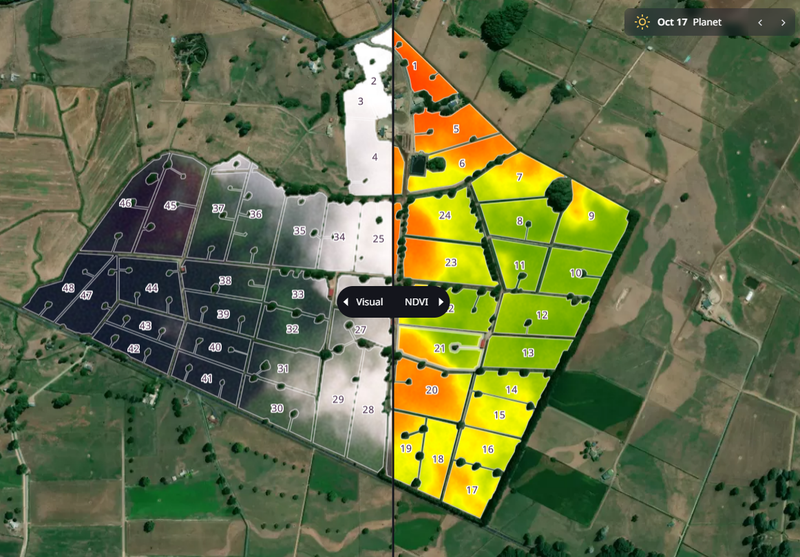
Satellite imagery can also be impacted by haze. When this occurs, the image may appear clear however the colours are muted and therefore the dry matter values are inhibited. A SPACE™ report will not be available for a haze impacted image as paddock pasture covers read significantly lower than what is true.
There are different metrics that can be selected to assess pasture cover or plant health:
- Visual (RGB) is what would be seen if looking down from space. You can use this view to check for clouds or other atmospheric anomalies on your images.
- Dry Matter is the estimated average pasture cover available (in kgDM/ha) and is based on the standard New Zealand ryegrass/clover blend. This is presented with a shadow and cloud mask applied, so that atmospheric impact to your farms image is excluded from calculation.
- Normalised Difference Vegetation Index (Red) (NDVI (Red)) is used to measure plant health. As it is positively related to Dry Matter, the two metrics typically generate consistent colour-coding. NDVI is recommended to be used for paddocks that are in crop, which may not produce precise dry matter estimates.
- Vegetation falls in the 0 (unhealthy) to +1 (very healthy) range:
- Healthy plant biomass is shown in light green to solid green (closer to 1)
- Less healthy plant biomass is shown in yellow to red (closer to 0)
- Vegetation falls in the 0 (unhealthy) to +1 (very healthy) range:
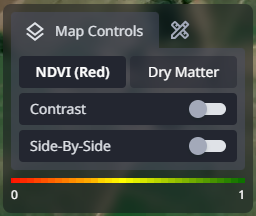
The legend in the Map Controls menu is measured from 0 (red) to 1 (green) and can be adjusted to other predefined palettes (see below). Non-vegetative objects such as dry land will show as grey.
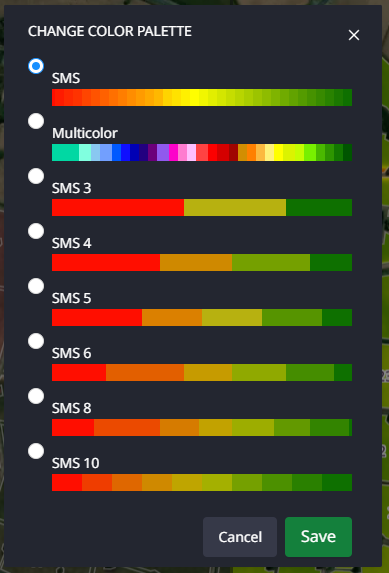
The colour palette for the legend can be adjusted under the Map Controls menu. Simply click the legend and select your preferred option, such as to make the colour-scale more granular to better highlight variability or to suit personal preference.
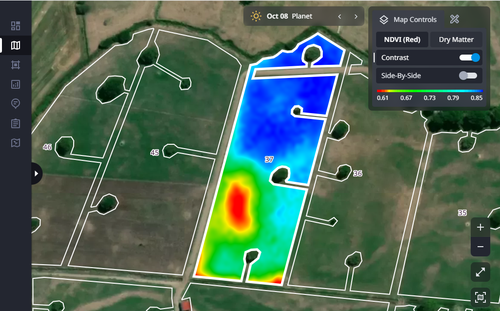
This tool can be used to assess the variability of NDVI for a selected paddock. In the Map Controls menu, adjust the slider bar to the right for ‘Contrast’ and select your paddock of interest.
The colouring of the paddock will update to reflect the variation in the chosen metric across its area. The colour-scale will display at the bottom of the Map Controls menu.
The Side-by-Side tool allows you to compare two satellite images at different dates and / or with different indices selected to identify areas that may require further investigation. This tool is activated by adjusting the ‘Side-by-Side’ function to the right in the Map Controls menu.
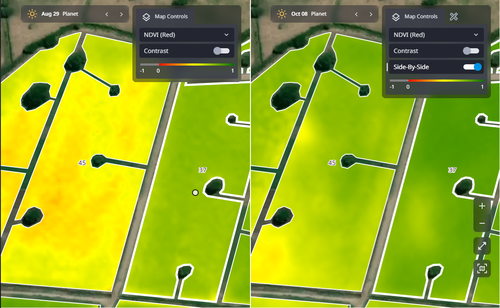
From there, select your desired image date, metric, and / or contrast view for each image. You will notice that the mouse cursor is mirrored on the opposite image for ease of comparing and observing the same area within a paddock.
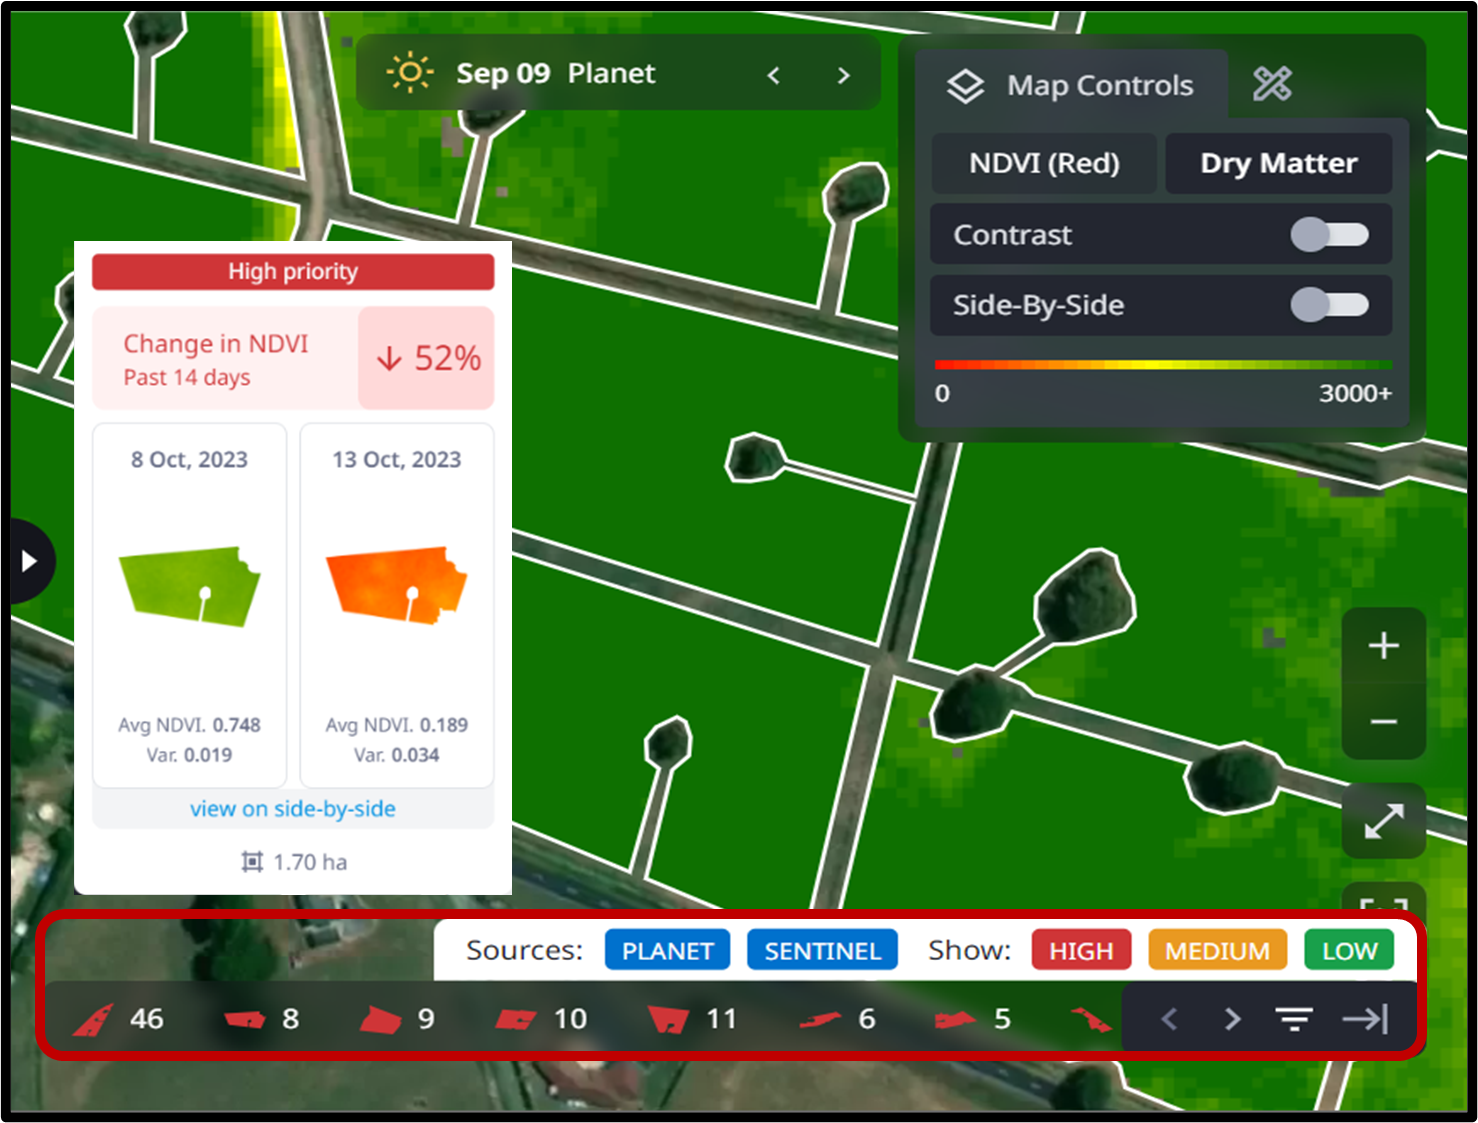
The Easy Scout menu, located at the bottom of the Map View screen, shows the paddocks that are experiencing the greatest change in average NDVI value over a period.
The algorithm reviews NDVI imagery for a given date range to determine whether vegetation health is declining or inclining, and then categorises paddocks as:
- red (high priority, and could include paddocks that have recently been grazed)
- yellow (medium priority)
- green (low priority).
Key things to note about Easy Scout:
- Paddocks are listed by ascending size of area.
- It uses the best available images, removing any images with cloud coverage >70%.
- The timeframe assessed is the previous 30 days for Sentinel and the past 14 days for Planet satellite imagery.
- You can view the results paddock-by-paddock or utilise the filter to view only selected satellite sources or priority ratings.
- You can hover your mouse over the Easy Scout menu to preview the details of highlighted paddocks.
- If the bar shows as ‘No data to be shown’, this is typically due to too many cloudy images being received and impacting the algorithm, which is therefore unable to decipher enough usable information from the data available.
The Map Tools menu allows you to measure paddock (or break-feed) dimensions, identify co-ordinates or customise imagery view (e.g. remove road or paddock names, activate dark mode). This includes:
- Measure Tool: used to calculate the distance or area between multiple user-defined points. To finish the measurement, double-click while measuring a distance, or click on the first point while measuring area. This may be helpful for planning break-feeds, for example.
- Coordinates Tool: identifies GPS coordinates for a desired location. Click on a location within the map to copy map coordinates onto the computer's clipboard. These can be shared with members of your farm team or supplier.
- Dark Map: toggles off the satellite imagery base layer to allow for a greater focus when analysing paddock plant health.
- Road and Field names: added to and removed from the Map view by toggling the button next to each option. This may be a helpful feature when sharing maps with external parties.
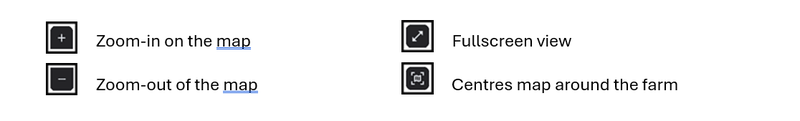
- Adjusting Zoom, Fullscreen, and Centring on your Property: The zoom, view and centring can be adjusted using the buttons on the right-hand side of the screen.
You can download satellite images for your entire farm or a single paddock for further analysis by you, your farm team or trusted advisor. The file download types that are available are:
- Tiff: contains the plant health image and underlying georeferenced data to allow for additional analysis outside of Cropwise Imagery.
- Tiff (Visual): contains the RGB or Visual image and underlying georeferenced data to allow for additional analysis outside of Cropwise Imagery.
- JPEG: compressed image file with the plant health image with no background or georeferenced data, optimal for keeping records or sharing with others.
- PNG: compressed image file with the plant health image with no background or georeferenced data, optimal for keeping records or sharing with others.
Downloading Whole-Farm Image
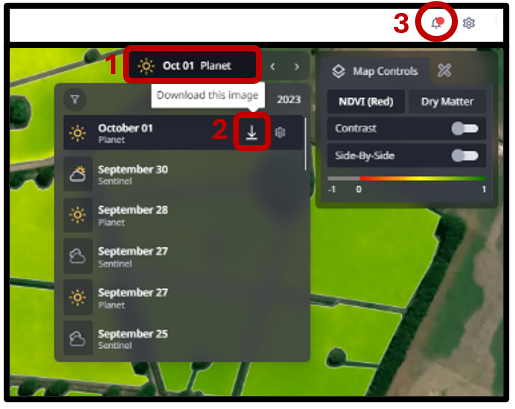
- Open the satellite images menu, then select the desired date within the image list.
- Next, click the ‘Download this image’ icon and choose the image format for the download. A message will appear notifying you that the file has been requested.
- When ready for download, the notification icon will display an alert (as shown). Simply click the notification icon to view the file and select the download button to access or share the file.
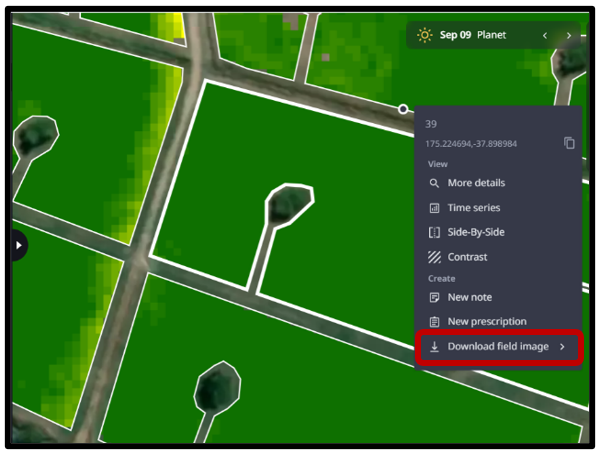
Downloading Paddock Specific Image
- Select the paddock of interest, then right-click your mouse to open the paddock-specific menu.
- Click the ‘Download field image’ menu and select the desired image file type. After selecting the desired file type, the success message will appear, and the file will begin downloading.