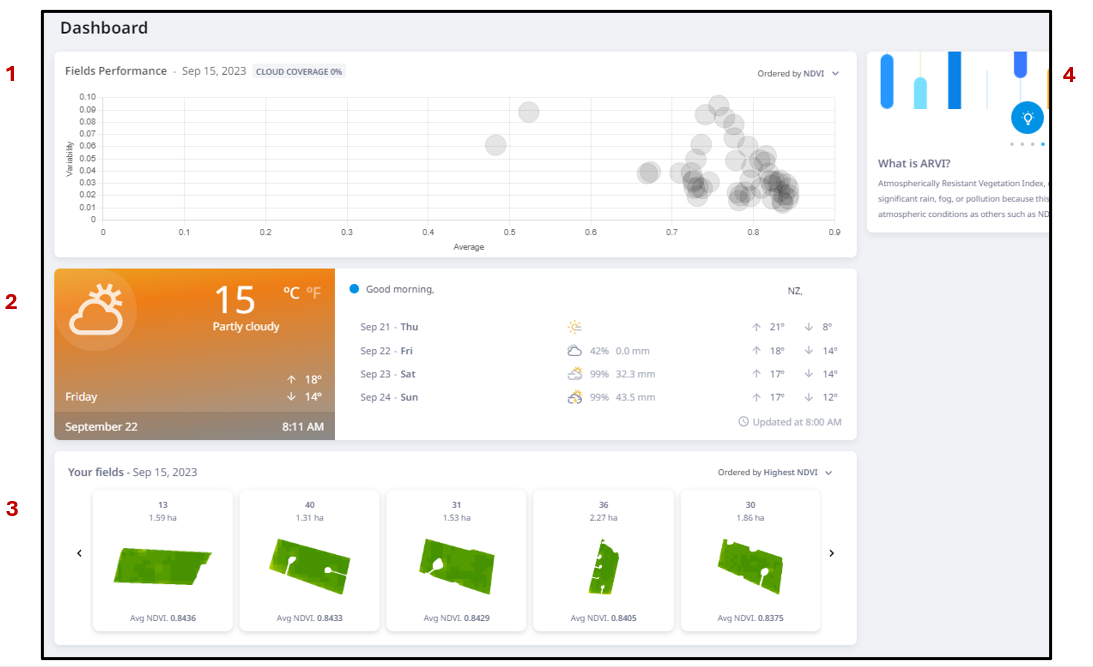
- Fields Performance displays a scatterplot for the most recent available image of all the fields for the farm. The scatterplot is based on Average and Variability values for NDVI or Dry Matter algorithms. Each dot can be hovered over to reveal paddock name, hectarage, average and variability values.
- Weather information displayed based on the location set for your farm. This will provide you with a guide as to when to expect your next clear satellite image.
- Your fields provides a snapshot of all of the vegetation health for each paddock on your farm, displaying each as a thumbnail from the most recent satellite image, ordered by Highest NDVI (default).
- Quick tips are located in the upper-right corner, providing helpful information about features within Cropwise Imagery.