All graphs can be downloaded as a CSV Report or a PDF Report using the ‘Download’ button located at the top-right of the screen. This can then be used by you or your farm team for further analysis.
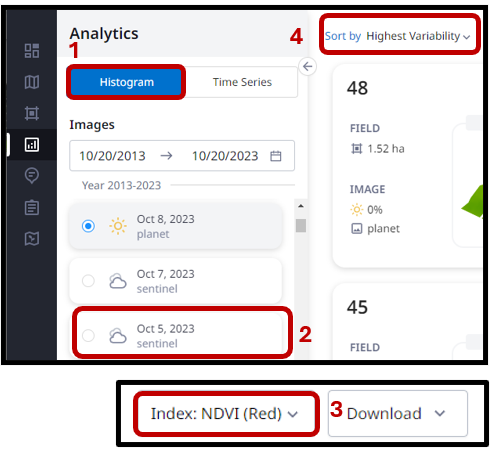
- Select the Histograms tab under the Analytics menu.
- Define the date range of interest. It is recommended that cloud impacted images are not used as the quality of analysis will be affected (e.g. only select images with a full sun icon).
- After selecting your image, choose a metric for analysis, being either Dry Matter (based on area that is not impacted by shadow or cloud) or NDVI.
The resulting histograms will be displayed by Highest Variability (default), although this can be changed using the ‘Sorted by’ menu options located at the top of the menu.
Helpful tips:
- Highlighting the mouse cursor within the histogram bars will highlight the areas within the paddock boundary thumbnail. This allows for a better understanding of what areas of the paddock have certain pasture cover or plant health index values.
- Selecting the 'Star' icon will favourite a paddock, which means it will be listed first regardless of selected order criteria. This would be done to paddocks for closer monitoring of changes in Dry Matter or NDVI, due to recent fertiliser application or damage to the paddock. By selecting the icon again, it will return the paddock to the standard consideration.
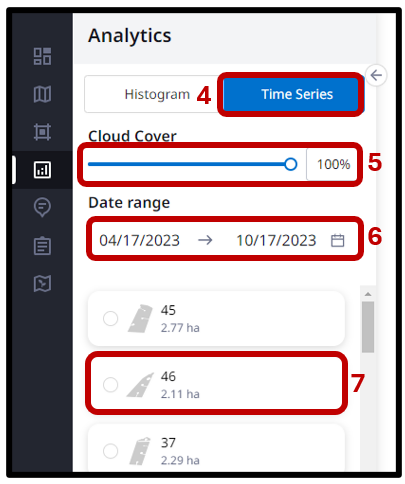
4. Select the ‘Time Series’ tab under Analytics menu.
5. Next you will need to define the parameters of the timeseries analysis by setting the Cloud Cover percentage.
6. Input date range.
7. Select paddock.
8. Confirm and view performance overtime.
Helpful tips:
- Each data point on the time series graph can be hovered over to view additional details, including a preview of that date's image.
- Cloud Cover can impact the quality of results and is evident by a sharp change in the plotted points. Simply adjust the Cloud Cover filter to observe the underlying trend in paddock performance over time.
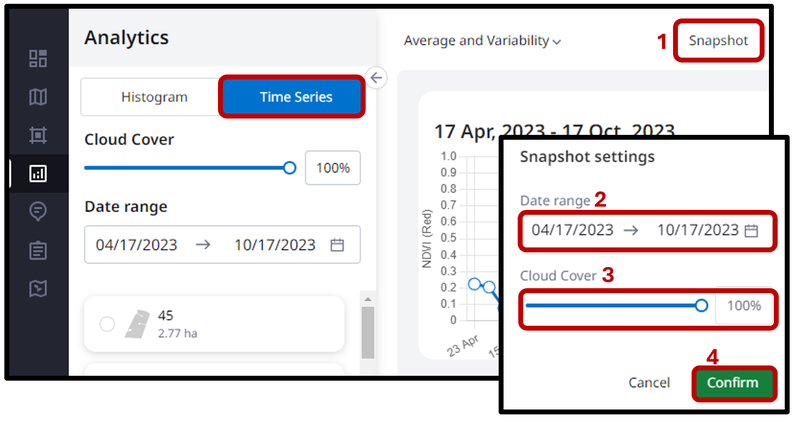
Snapshot combines the Histogram and Time Series information to allow for greater analysis of the selected images. The feature can be found at the top-right of the Time Series menu.
- Select the ‘Snapshot’ tab at the top of the window to set the parameters for your analysis.
- Input date range.
- Select your preferred Cloud Cover percentage.
- Select ‘Confirm’.
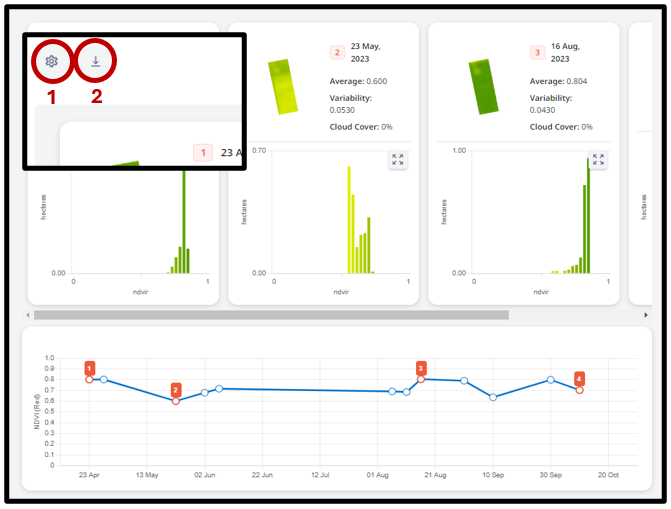
Once the analysis has been generated, the image dates for variability analysis (histograms) can be adjusted by clicking and dragging an image marker to a different date.
- If you wish to reset the analysis, select the settings icon located at the top of the screen.
- To save the image, select the download icon.