Not only do you get access to all high-resolution satellite images* of your farm right at your fingertips, you also have access to analysis that allows you to monitor and evaluate pasture cover and vegetation health across your farm to enhance pasture planning and management.
Overview
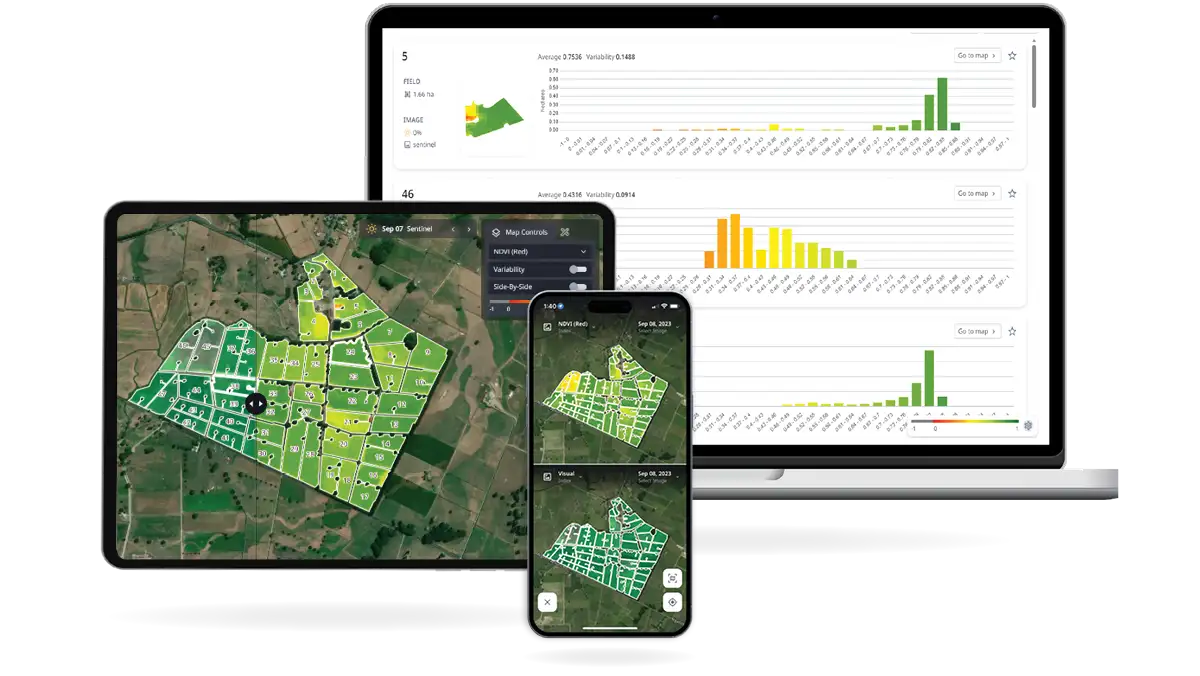
The Cropwise Imagery website includes various menus, each one offering a range of features to optimise the insights and analysis generated from your pasture. These are:
- Dashboard for a summary of your farm based on the latest satellite imagery, localised weather conditions and tips on Cropwise Imagery.
- Map View (default landing page) to easily view satellite images of your farm and carry out initial analysis to get an overview of pasture cover and vegetation health.
- Fields Area provides a list of all the paddocks on your farm by ascending area, and the ability to edit paddock boundaries or add new paddocks to your farm.
- Analytics of pasture cover or vegetation health variability within a paddock at a selected point in time, and trends in pasture cover or vegetation health over time.
- Notes to record observations of interest within a paddock, which can be viewed by others.
- Prescription to generate management zones based on pasture cover or vegetation index values in the paddock for a tailored prescription.
- Productivity Map combines timeseries and variability analysis to identify areas of a paddock that are performing well and areas that may need attention by overlaying historical images into one view.
* You will only receive a SPACE™ report when a clear image is available, which can be up to 72 hours after image capture.
An image may not be available every day due to variations in satellite pathing.
Modelled estimates are not included in Cropwise Imagery, which presents satellite - based information only. This data does not flow through to MINDA® Land & Feed.