
This was an excellent decision by NZAEL, as traditionally these haven’t been released until February, when the spring mating season is complete for dairy farmers.
Although the changes still don’t come in to effect until February 2019, the move is pragmatic, because it allows New Zealand dairy farmers to make informed decisions (i.e. bull selections) before the mating season gets underway.
The economic changes also better-align world commodity prices that our milk processors receive with the various milk/animal components that make up breeding worth.
Before the September announcement, LIC’s genetics and sire selection staff had already selected its 2018 Premier Sires teams based on the likely changes NZAEL would make, and had ranked the bulls accordingly on the spring edition of the Premier Sires Wall Chart (sent to LIC farmers in August).
Now the official economic values have been released, we’re able to include a new set of BWs for the bull teams (and individuals) that LIC markets: You will note the 2019 BW columns in the Premier Sires tables.
Right here, right now
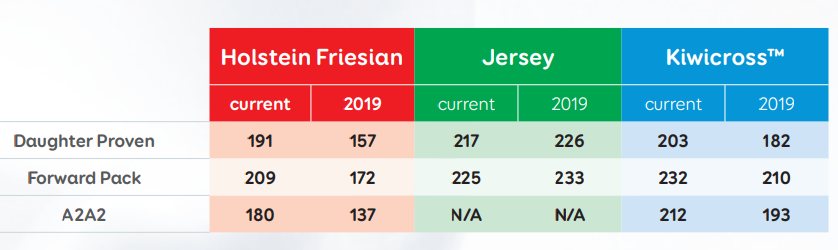
The table below summarises the movements for each LIC Premier Sires team, with ‘current’ column indicating how the teams sit now, and the ‘2019’ column showing how the teams will reposition in February 2019 (under the officially-released economic rankings, all other factors being equal).
Breed changes are a reflection of the economic values’ impact on the traits associated within each breed, and breed choices remain the domain of LIC’s farming customers.
But whether you’re looking at current BW or 2019 BW, LIC remains a strong competitor in all three breeds it markets: Holstein Friesian; Jersey, and; KiwiCross.
Another factor that remains the same is that Premier Sires teams deliver LIC’s best available genetics, through its liquid technology, on any given day, regardless of breed.
Premier Sires teams current BW vs 2019 BW
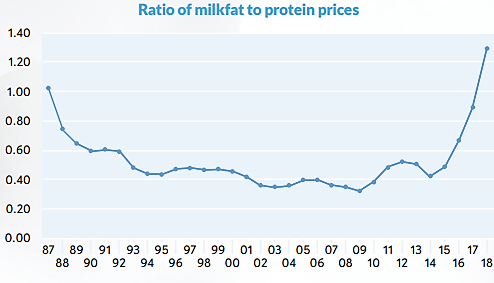
Fonterra’s current three-year rolling average for value component (VCR) ratio sits at 1.3.
Although likely to rise over the next few seasons, the current VCR of 1.01 that feeds into BW (which NZAEL is using) reflects a ‘long term view’ of fat values; over the long term these values are expected to plateau and move closer to parity with protein values.
BW remains the best indicator to use among farmers who want to breed progeny that are profitable and efficient convertors of feed into what our milk processors are paying, and being paid, for.
How the ratio of fat to protein has risen significantly since 2016.
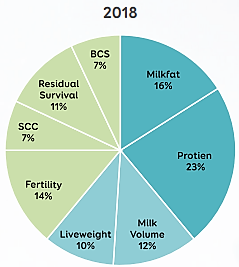
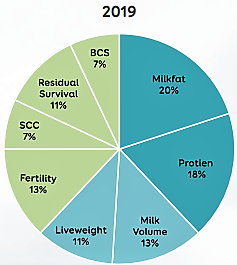
What’s driven the economic changes?
Cows naturally produce more kilograms of fat compared to protein. The base cow (that the industry uses as a benchmark in BW values), born in 2005, which came into milk in 2007, produced 218kg of fat and 174kg of protein when fed five tonnes of dry matter.
With processors receiving more money for fat than protein, the new weightings for 2019 better reflects long term predictions of where fat is likely to sit relative to protein.
Effective emphasis on the individual traits within Breeding Worth (NZAEL graphic, reproduced with permission from DairyNZ).
Article by Greg Hamill, Genetics Business Manager