But when it comes to ‘empty rate’, this often isn’t the case because it’s not always calculated the same way on-farm.
Levelling the playing field
Empty rate is usually the percentage of the herd that was diagnosed as ‘empty’ on the day of pregnancy testing. Depending on which cows are scanned on the day, your empty rate could look better than it actually is, leading to you to compare ‘apples with elephants’.
Example
Farmer Joe and Jane compare their empty rates:
- Farmer Joe
pregnancy tests his whole herd, and on the day of scanning his ‘empty rate’ is
15%
- Farmer Jane has been watching her herd leading up to
scanning day. She knows that there are
30 cows that are not pregnant as she’s seen them bulling. Jane knows she’ll be culling all of her
empties, so decides to help her cash flow by not paying to get those 30 cows
pregnancy tested. On the day of
scanning, her ‘empty rate’ is 13%.
Based
on these results, it looks like farmer Jane has the better empty rate. But if those 30 empty cows she didn’t scan were
added to her empty rate, her empty rate would actually be 16%. This is why it’s important to use an industry
standard measure when comparing your results with your neighbours, or across
years.
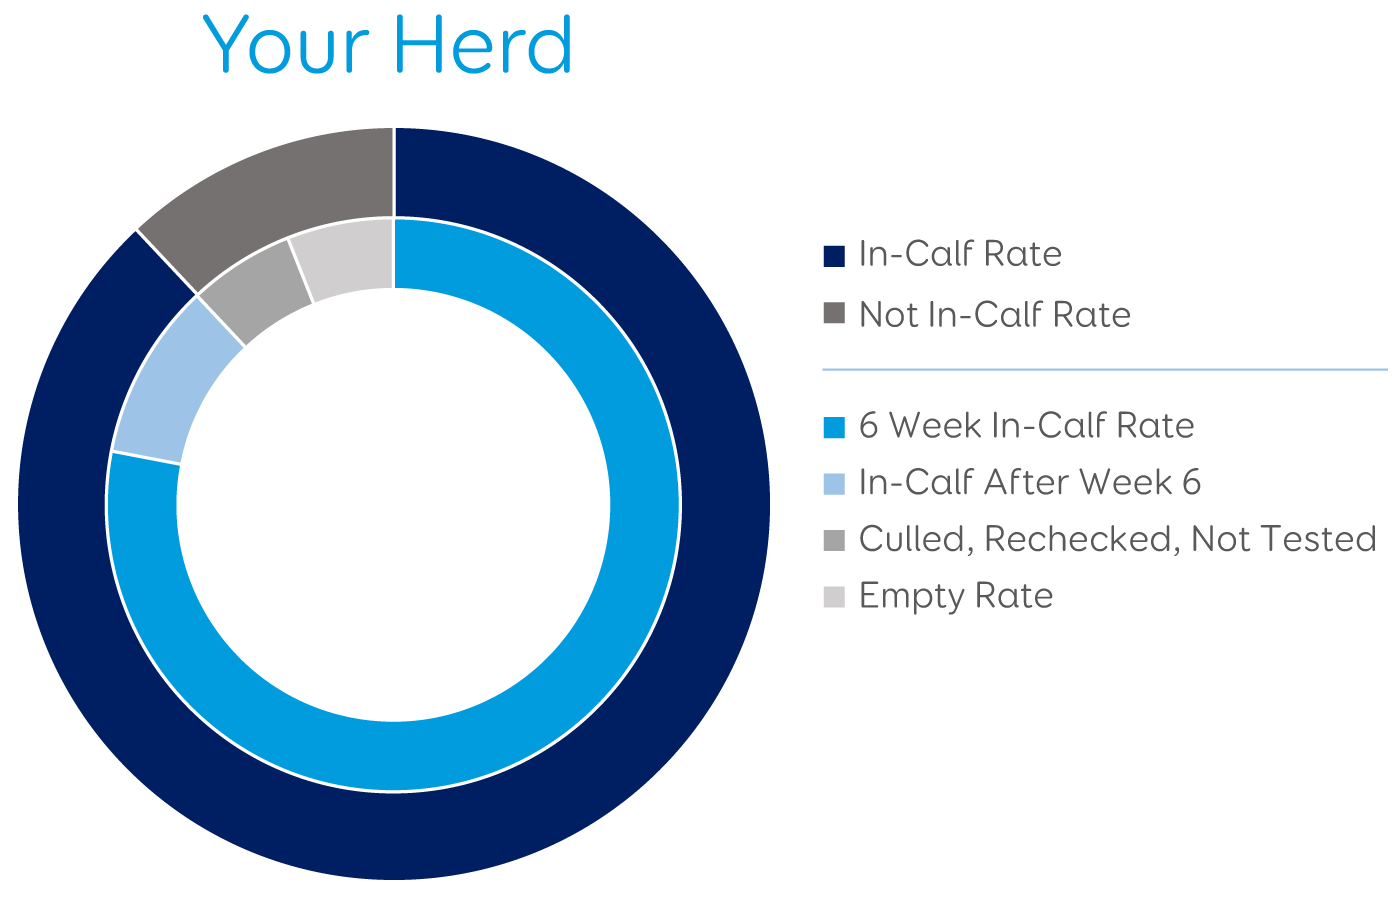
Use not-in-calf rate
The industry standard measure used is not-in-calf rate (NICR) - the percentage of the herd that have not been recorded as ‘pregnant’.
NICR calculations are based on the number of cows that calved that season and were still there at mating start date (the eligible cows group used in the Fertility Focus report), rather than just the cows scanned on the day. This means everyone’s results are based on the same group of cows, making it a level playing field for comparison.
However, when looking at NICR, we often hear “I didn’t have that many empty cows”. And you’re right, you may not have.
NICR is often higher than empty rate because it’s not just the percent of the herd recorded as empty. As well as the cows recorded as empty, NICR includes:
- Cows culled without a pregnancy test result
- Cows in the herd without a pregnancy test
result, and
- Cow still recorded as ‘doubtful’
From the scenario above, those empty cows that Jane didn’t scan would be included in NICR as ‘cows in the herd without a pregnancy test result’, giving Jane an accurate reflection of her herd’s performance.
Mating length matters
Another important factor to keep in mind when comparing NICR is mating length.
Almost anyone can get a 6% NICR/empty rate if they mate for long enough. This is because, as mating length increases, in general, NICR decreases. Plus, the difference in NICR between a herd with a good vs. an average 6-week in-calf rate gets smaller the longer you mate for*.
Not-in-calf rate by mating length
|
10 weeks |
11 weeks |
12 weeks |
13 weeks |
|
|---|---|---|---|---|
|
Average herd |
10 weeks 20% |
11 weeks 18% |
12 weeks 16% |
13 weeks 15% |
|
Top quartile herd |
10 weeks 15% |
11 weeks 13% |
12 weeks 12% |
13 weeks 12% |
|
Difference |
10 weeks 5% |
11 weeks 5% |
12 weeks 4% |
13 weeks 3% |
So when you’re comparing your NICR to last year’s result or your neighbours result, keep in mind mating length. For example, if your NICR is higher than last year’s result, did you shorten mating length this year?
Industry standards are key
Based on your herd’s reproduction results, you will make management decisions. Using an industry standard measure (e.g. not-in-calf rate) and understanding the factors that influence that measure (e.g. mating length) are the key to getting accurate results to base your management decisions on.
In other words, industry standards help you to keep your apples separate from your elephants!
*These figures are from the analysis of the 2016 spring mating results for 3,852 herds. Herds were included in the analysis if they were spring calving seasonal herds that had a Detailed InCalf Fertility Focus Report.
Disclaimer: The reproduction measures analysed were calculated from data and information entered by herd owners and collected by LIC & DairyNZ. Accuracy of the results reported here is subject to the accuracy of the data entered.