The expected calving date is calculated based on how long the cow is expected to be pregnant for (her gestation length), which can vary.
Dairy cattle gestation length is considered to be roughly 282 days in the field; the rough length of time between conception of the pregnancy and the birth of the calf. Gestation length, however, is variable between individual animals due to its moderately high heritability (ability to be passed to the next generation) and is influenced by factors like calf gender, dam age, and breed:
Gestation length by calf gender
Research (Donkersloot, 2014) on more than 58,000 New Zealand animals found the average gestation length to be:
- 282.7 days for bull calves
- 281.2 days for heifer calves
Gestation length by dam age
In the same study, the average gestation length was shorter in first-calving cows - 279.5 days for first calvers and 280.8 days for second calvers.
Gestation length by dam breed
The average gestation length breeding value (BV) of herd tested cows in 2016 was:
- -1.2 days for Holstein Friesian
- -1.4 days for Kiwicross
- -0.3 days for Jersey
Please note that any reference to BVs refers to BVs generated by NZ Animal Evaluation. These are distinct from the estimated breeding values (EBVs) produced by BREEDPLAN.
BVs are an estimate of a cow or bull’s genetic merit for a trait. The accuracy of this estimate increases as more information feeds into it when farmers record matings and calvings.
NZ Animal Evaluation-enrolled sires will have publicly available gestation length BVs. These can be found by searching for sires individually on DairyNZ’s website.
It is important to take note of the % reliability figure next to the BV itself, as bulls with no recorded ancestry, progeny information or own GL will be given a default BV and are likely to have a 0% reliability value. Once the sire has calvings recorded against it, this % figure will increase as the BV will become more accurate and better reflect what happens on farm at calving time.
Whilst all sires will possess a BV, this will only be public if the enroller of the bull opted to enrol the bull for evaluation, as opposed to enrolling the bull for just an AB Code.
The average dairy cow is assumed to have a gestation length BV of 0 days. A negative gestation length BV would indicate that a cow mated to that is likely to calve earlier than if she was mated to a bull with a gestation length of 0. Whereas, a cow mated to a bull with a positive gestation length BV is likely to calve later than if she was mated to a bull with a gestation length BV of 0.
For example, a cow mated to a bull with a gestation length BV of -2.0 days would mean that she would calve approximately one day earlier than average. The reason this would only be one day early instead of two, is that bulls and cows each transmit approximately half of their genetics to the calf, so roughly half the gestation length potential comes from the bull, and the other half from the cow.
BVs produced by NZ Animal Evaluation, unlike BREEDPLAN EBVs, can be compared across breeds. This is because the BVs are calculated using the national dairy herd’s information as its reference population, so the BVs are calculated on the ‘dairy scale’ regardless of whether the animal with the BV is Friesian, Jersey, Ayrshire, Angus, Hereford, Simmental etc.
For example, data suggests that Angus have a natural gestation length of approximately 281 days (similar to a dairy cow), whereas Hereford have a slightly longer gestation length than a dairy cow (approximately 284-285 days). In this instance, we would expect to see the average Hereford sire to have a gestation length that is 3-4 days longer than the average Angus sire.
However, there is always variation within a breed, and some bulls – irrespective of breed – will have shorter gestation lengths than others. This was clearly demonstrated by NZ Beef & Lamb’s dairy-beef progeny test trial where there was considerable variation in gestation length even within breed.
Animal evaluation uses calving and associated mating information, along with the sires’ gestation length BV in determining which bull sired which calf.
The rules around whether a sire is assigned to a calf also depend on calf gender and whether the calf is a single or one of multiple. Animal evaluation uses 282 days for heifer calves, 283 days for bull calves, and 276 days for multiple births.
Matings that fall within an 11 day window of the estimated mating date are accepted. The calculated mating date is worked out using the actual calving date minus 282, 283, or 276 days depending on calf gender and whether it’s a multiple, and then adding half of the sire’s gestation length BV, as roughly half of the calf’s genetics come from its sire.
MINDA’s expected calving dates take both sire and dam gestation length into account by using breeding values to estimate the expected gestation length.
For example the expected calving date would be the mating date + 282 days + (half of the sire gestation length BV) + (half of the dam’s gestation length BV).
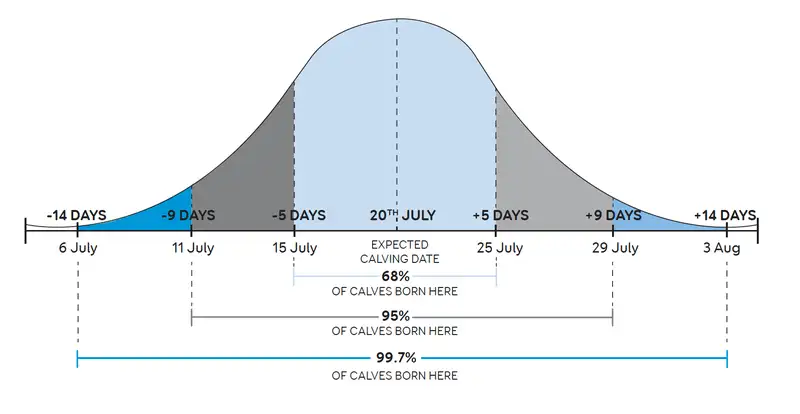
Yes. New Zealand research on dairy animals determined the distribution of gestation length.
Winkelman and Spelman (2001) found:
- The average gestation length was 282.7 days for bull calves
- The average gestation length was 281.2 days for heifer calves
- The standard deviation was 4.6 days
95% of calvings should fall within two standard deviations of the average. Meaning, we expect to see 95% of calves born within ± 9 days of their due date.
For example, if 100 heifers were expected to calve on 20 July. 95 of them should calve between July 11 and 29. The other five heifers would be expected to calve outside of this window.
This is unknown, however, in the SGL Dairy breeding scheme there are calves being born around 262 days of gestation that are healthy. Donkersloot (2014) found the gestation length range for viable calves was 242-298 days.
Donkersloot (2014) found that first calvers had a gestation length one day less than second calvers. This has also been reported in King, Seidel, and Eslden (1985), and Dhakal et al. (2013).
Heritability estimates for gestation length in cattle varies with research suggesting between 0.32 and 0.68 (Baker et al., 1990; Winkelman & Spelman, 2001; Maltecca et al., 2011; Stachowicz et al., 2015; Amer et al., 2016).
What this means is that genetics accounts for between 32% and 68% of the variability we see in cattle gestation length.
A heritability figure of 0.0 (or 0%) would indicate that all of the variability was due to environmental factors, whereas a heritability figure of 1 (100%) would indicate that all of the trait variation was due to genetics.
Traits like gestation length that sit between 0 and 1 indicate that a mixture of environmental (non-genetic) and genetic factors have a part to play.
Calving Difficulty
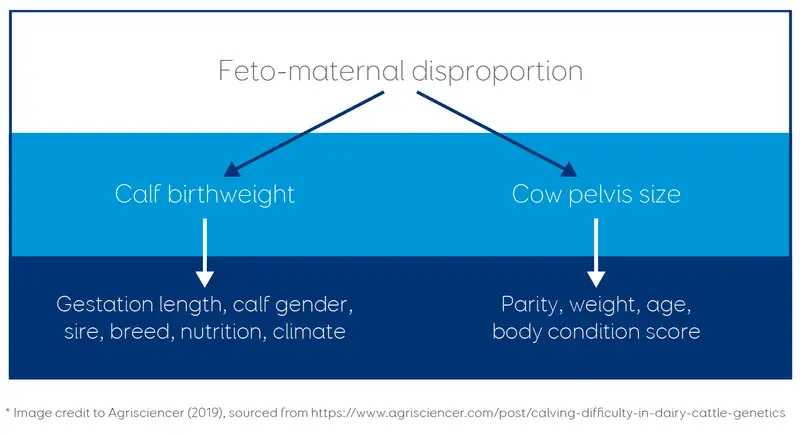
Higher birthweights are generally linked to calving difficulty, although dam and calf conformation can mean that heavier calves don't always cause complications. It is important to remember that whilst LIC selects for easier-calving sires and reports calving difficulty/calving ease breeding values where available, there is always natural variation within a trait. This means that even some of the easiest calving sires can still be associated with difficult calvings. The use of larger breeds (i.e. beef) can increase the risk of calving difficulty, but a number of factors also influence this:
Farmers have a multitude of jobs to focus on at calving time, which can result in reduced recording of calving difficulty. MINDA recording makes this simple by offering the option to enter calving assistance that was required when recording a calving. These calving assistance codes range from the calving being unobserved through to major assistance being required. These codes are utilised by NZ Animal Evaluation's calving difficulty BV model to produce calving difficulty BVs for enrolled sires.
A sire’s Calving Difficulty Breeding Value (BV) predicts the percentage of assisted calvings expected when he is mated to yearling heifers (Heifer Calving Difficulty), or cows (Cow Calving Difficulty).
Cow calving difficulty breeding value for a sire is calculated from the difficulty its progeny has been born from a three-year-old cow or older, expressed as a percentage of assisted calvings expected, compared to a bull of 0.
Heifer calving difficulty breeding value for a sire is calculated from the difficulty its progeny has been born from a two-year-old cow, expressed as a percentage of assisted calvings expected compared to a bull of 0.
Half of a bull’s BV is transmitted to his progeny. For example, a bull with HCD BV of -2 can be expected to have 1% fewer calving difficulty events than the reference point.
The information on calving difficulty breeding values is supplied to assess the suitability of bulls for mating with cows and yearling heifers and to give farmers knowledge about bulls which may cause higher than usual rates of calving assistance.
NZ Animal Evaluation calculates two separate breeding values (BVs) for enrolled sires - one for cows, (Cow Calving Difficulty), and another for yearling heifers, (Heifer Calving Difficulty).
Ancestry information and calving assistance records from farmers are utilised to produce the estimates.
The reliability figure reflects the amount of ancestry or progeny information contributing to the BV. More detail sits in the BW Bull file, which specifies the number of calving records feeding into each Calving Difficulty BV for every bull.
In December 2024, updates to the NZ Animal Evaluation calving difficulty model were made.
The new model considers both the direct and maternal effects of calving difficulty and adjusts for the contribution of the maternal effects when reporting the direct calving difficulty BV for both Heifer and Cows. More information can be found on the DairyNZ website.
For reference, the average calving difficulty BVs* for sires of various breeds are below:
|
Sire Breed Averages |
H-FRI |
JER |
XBR |
|---|---|---|---|
|
Heifer calving difficulty (%) |
H-FRI 6.72 |
JER -8.30 |
XBR -1.11 |
|
Cow calving difficulty (%) |
H-FRI 1.26 |
JER -2.04 |
XBR -0.58 |
*Data source LIC, January 2025 and based on LIC bulls from 2015 to 2025.
Calving Difficulty Reliability
The accuracy of heifer and cow calving difficulty will vary depending on the age of the sire and on how widely used he has been within the industry, young sires generally will have a low reliability compared to an older sire.
Reliability figures will also vary between the heifer calving difficulty BV and the cow calving difficulty BV depending on his use over those cohorts of animals.
It is highly recommended that farmers utilise the reliability figures of the calving difficulty BVs when making breeding decisions around calving difficulty. For example, reliability figures around 30% would indicate there is little more information above parent average feeding into the breeding value, and figures over 60% would indicate there would be a minimum of 100 calvings feeding into the BV.
Where does the calving assistance information come from?
Heifer calving difficulty BV uses all heifer calving assistance records because of the low number of heifer calving records to AB matings.
Cow calving difficulty BV uses selected herds based on the quality of their calving records. These are largely made up of progeny test scheme herds or those recording Traits Other Than Production (TOP).
It takes approximately 2000 calvings to reach a reliability above 90%.
LIC will use all information that is available for each bull.
For first-time marketed bulls, LIC selects bulls based on birth weight, gestation length and calving ease, marketing those deemed suitable for use in the dairy industry based on beef BREEDPLAN information and NZ Dairy Beef progeny test data.
Once bulls have been used in the dairy industry, the reliability of the calving information will increase and will be taken into consideration along with any genotype information.
Note: Beef breed societies have their own BREEDPLAN systems, which allows identification of superior bulls within breed. BREEDPLAN EBVs cannot be compared across different beef breeds and are read differently to NZ Animal Evaluation BVs.
It varies. An Australian study in a number of beef breeds found heritability ranged from 0.36-0.46 (Jeyaruban et al., 2016). This means that genetics accounts for between 36% and 46% of the variability we see in birthweight.
A heritability figure of 0.0 (or 0%) would indicate that all of the variability was due to environmental factors, whereas a heritability figure of 1 (100%) would indicate that all of the trait variation was due to genetics.
Traits like calf birthweight that sit between 0 and 1 indicate that a mixture of environmental (non-genetic) and genetic factors have a part to play.
Unfortunately yes, data suggests that the incidence of calving difficulty is highest in first calvers (Funnell & Hilton, 2016). This is the case for both dairy and beef breeds.
A US study in beef cattle found that malpresentation of the calf during calving (i.e. breech) occurred in up to 4% of calvings. This accounted for up to 22% of calving difficulties reported and was found to occur more commonly in cows that had had more than one calf. In fact, calf malpresentation accounted for up to 40% of reported calving difficulty in cows that had produced at least one calf (Funnell & Hilton, 2016).
A huge number of genetic and environmental (non-genetic) factors play a role in calving difficulty, here are some of them:
- Sire Selection
It’s important that the calf’s sire is carefully selected for calving ease (Funnell & Hilton, 2016). For bulls with reliable NZ Animal Evaluation calving difficulty BVs, selection for low BVs can help reduce the chance of a difficult calving, and for beef bulls these should be used (if available) in conjunction with BREEDPLAN EBVs for birthweight and calving ease traits. - Yearling Heifer Growth
Proper heifer development is important not only for reaching puberty early and lifelong reproductive efficiency, but also for the prevention of calving difficulty. Poorly grown heifers are more likely to encounter difficulty at calving time (Funnell Hilton, 2016) regardless of what breed of sire is used over them. - Dam Nutrition
Calf birth weight can be manipulated by cow nutrition, particularly during the third trimester when the calf is at its maximum growth rate. However, there are conflicting reports around the influence of nutrition. In both extreme overfeeding and underfeeding situations the risk of calving difficulty is increased (Funnell & Hilton, 2016; Gunn et al., 2014).
This can result from overly large calves, heifers and cows having excess fat deposits in the pelvis, whereas under-conditioned animals can lack the energy to deliver their calf.
There are also some reports that early and mid-gestation nutrition may have a greater impact on birthweight than late gestation nutrition, as cows that were fed an energy-restricted diet in early pregnancy had heavier placentas than those fed adequately (Rice, 1994; Micke et al., 2010).
References
Amer, P. R., Stachowicz, K., Jenkins, G. M., Meier, S. (2016). Short communication: Estimates of genetic parameters for dairy fertility in New Zealand. Journal of Dairy Science, 99(1), 8227-8230
Baker, R. L., Carter, A. H., Morris, C. A., & Johnson, D. L. (1990). Evaluation of eleven cattle breeds for crossbred beef production: Performance of progeny up to 13 months of age. Animal Production, 50, 63-77
Dhakal, K., Maltecca, C., Cassady, J.P., Baloche, G., Williams, C.M., & Washburn, S.P. (2013). Calf birth weight, gestation length, calving ease, and neonatal calf mortality in Holstein, Jersey, and crossbred cows in a pasture system. Journal of Dairy Science, 96: 690-698
Donkersloot, E. (2014). Association mapping of gestation length in New Zealand dairy cattle (Master’s thesis, Wageningen University, Wageningen, Netherlands)
Funnell, B. J., & Hilton, W. M. (2016). Management and Prevention of Dystocia. Veterinary Clinics of North America: Food Animal Practice, 32, 511-522
Gunn, P. J., Schoonmaker, J. P., Lemenager, R. P., & Bridges, G. A. (2014). Feeding excess crude protein to gestating and lactating beef heifers: impact on parturition, milk composition, ovarian functions, reproductive efficiency and pre-weaning progeny growth. Livestock Science, 167, 435-488
Jeyaruban, M. G., Johnston, D. J., Tier, B., & Graser, H. U. (2016). Genetic Parameters for calving difficulty using complex genetic models in five beef breeds in Australia. Animal Production Science, 56, 927-933
King, K.K., Seidel, G.E., & Elsden, R.P. (1985). Bovine embryo transfer pregnancies, II. Lengths of gestation. Journal of Animal Science, 61: 758-762.
Maltecca, C., Gray, K. A., Weigel, K. A., Cassady, J. P., & Ashwell, M. (2011). A genome-wide association study of direct gestation length in US Holstein and Italian Brown populations. Animal Genetics, 42(6), 585-591
Micke, G. C., Sullivan, T. M., Rolls, P. J., Hasell, B., Greer, R. M., Norman, S. T., Perry, V. E. A. (2010). Dystocia in 3-year-old beef heifers: relationship to maternal nutrient intake during early- and mid-gestation, pelvic area and hormonal indicators of placental function. Animal Reproduction Science, 118(2-4), 163-170
Rice, L. E. (1994). Dystocia related risk factors. Veterinary Clinics of North America: Food Animal Practice, 10, 53-68
Stachowicz, K., Jenkins, G. M., Amer, P. R., Bryant, J. R., & Meier, S. (2015). Proposed changes in the genetic evaluation of dairy fertility in New Zealand. Proceedings of the Association for the Advancement of Animal Breeding and Genetics, 21, 370-373
Winkelman, A.M., & Spelman, R.J. (2001). Selection for reduced gestation length in New Zealand dairy cattle. Association for the Advancement of Animal Breeding and Genetics, 14:63-66.