As part of LIC’s commitment to faster genetic gain, its science team recently investigated the full spectrum of MINDA herds in search of the ‘best cows’, which included whether a clear correlation existed between breeding worth (BW) and production efficiency.
The research re-affirmed high BW cows were more efficient milk producers than low BW cows, and that long-term users of LIC genetics continued to achieve faster rates of genetic gain than other farmers.
Close to 1 million cows, from current MINDA and Herd Tested herds aged between 4 -8 years-old, were grouped by breed and split into quartiles based on BW rank: The average (per-cow) milk production, liveweight, and fertility breeding value (BV) from each quartile was calculated.
Results showed a staggering variation in milk production and efficiency between the ‘top-quartile’ and ‘bottom-quartile’ of the cows, at an average of 65kg of milksolids, per cow, per season.
The top quartile, high-BW, cows also had a lower liveweight BV, and a better fertility BV, compared to their lower BW herd mates.
David Chin, LIC chief executive said the data showed the progress farmers have made since turning their focus to improving cow quality on their farms.
And there was plenty of opportunity that was still there for the taking, Chin said.
“This data shows that high-producing, climate-friendly cows aren’t just a hope for the future. They exist in the national herd today.
“If we’re going to meet our sector’s goals, we must sharpen our focus on only breeding these highly efficient cows that sit at the top, and not create replacements that sit at the bottom. We’ve got the tools and the data to show further improvements in production efficiency are well within reach for every dairy farmer – and some herds are already doing it.”
Long-term users of LIC genetics are breeding these better cows, faster
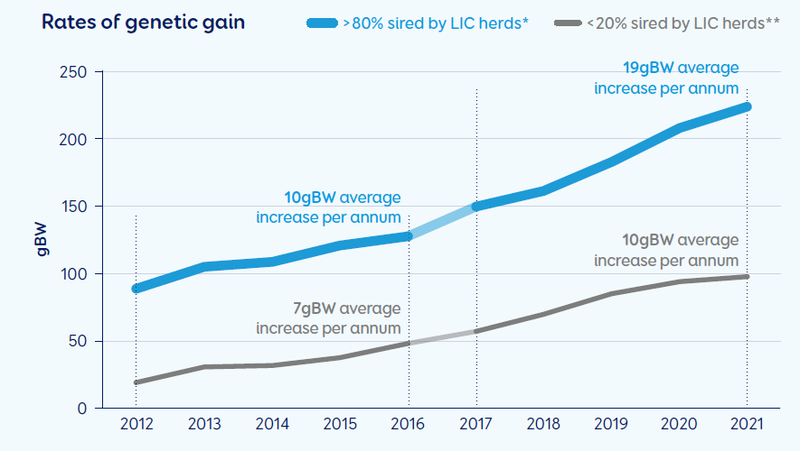
The research also took a closer look at the rates of genetic gain that long-term users of LIC genetics were achieving.
To calculate the ‘rate of genetic gain’, the difference in gBW between one year of replacements versus the following year was compared.
Between 2017 – 2021, LIC ‘long-term users’ (herds with more than 80% progeny sired by an LIC bull over the last 10 years), had achieved almost double the rate of genetic gain per year compared to herds with less than 20% progeny sired by an LIC bull (19 gBW vs. 10 gBW).
Chin said the findings confirmed the kind of gains that could be made with a strong focus on herd improvement and consistent use of high-BW bull teams.
“It’s really encouraging to see that farmers that have predominantly been using LIC bulls are achieving markedly higher rates of genetic gain in their herds. The bigger jumps in BW between each year of replacements, the faster you’re moving towards milking more emissions efficient cows.”
Alongside farmers’ herd management decisions, genomics has been the key contributor to the increased rate of genetic gain, Chin said.
“It’s no coincidence that the increased utilisation of genomics in our breeding programme and increased farmer uptake for young, genomically selected sires has gone hand in hand with higher rates of genetic gain in farmers’ herds.
“By drawing on information from a bull’s DNA, we’re able to more-accurately identify high genetic merit sires at a young age and make these elite genetics available to farmers to breed from as early as possible.”
If the industry’s average rate of genetic gain increased to match herds that are long-term users of LIC genetics, it would go a long way to minimise any decline in national milk production with a declining cow population.
“There are a number of factors influencing a farm’s productivity and environmental efficiency, but the contribution made by genetic gain cannot be underestimated,” Chin said.
“Our data shows there are already herds in New Zealand that are achieving substantial gains in genetic merit which are delivering noticeable value to these farms in the form of increased production efficiency and improved environmental efficiency.
“The genetics and technology to help farmers breed better cows, faster is here now and we’re proud of the role we play in helping farmers achieve just that.”
Contact your Agri Manager for a personalised discussion on how LIC can help you reach your herd improvement goals.
Close to 1 million cows, from current MINDA and Herd Tested herds aged between 4 -8 years-old, for the 2020/21 season, were grouped by breed and split into quartiles based on BW rank: The average (per-cow) milk production, liveweight, and fertility breeding value (BV) from each quartile was calculated.
Results showed a staggering variation in milk production and efficiency between the ‘top-quartile’ and ‘bottom-quartile’ of the cows.
Weighted Averages across the three breeds
|
BW Quartile |
Animal Count |
Average gBW |
Average KGMS |
Average LWGT gBV |
Average FERT gBV |
|---|---|---|---|---|---|
|
BW Quartile Q1 |
Animal Count 216,413 |
Average gBW 201 |
Average KGMS 502 |
Average LWGT gBV 2 |
Average FERT gBV 1 |
|
BW Quartile Q2 |
Animal Count 216,413 |
Average gBW 145 |
Average KGMS 473 |
Average LWGT gBV 5 |
Average FERT gBV 0 |
|
BW Quartile Q3 |
Animal Count 216,413 |
Average gBW 103 |
Average KGMS 458 |
Average LWGT gBV 8 |
Average FERT gBV 0 |
|
BW Quartile Q4 |
Animal Count 216,411 |
Average gBW 39 |
Average KGMS 437 |
Average LWGT gBV 12 |
Average FERT gBV -1 |
Holstein-Friesian
|
BW Quartile |
Animal Count |
Average gBW |
Average KGMS |
Average LWGT gBV |
Average FERT gBV |
|---|---|---|---|---|---|
|
BW Quartile Q1 |
Animal Count 51,375 |
Average gBW 163 |
Average KGMS 518 |
Average LWGT gBV 37 |
Average FERT gBV 0.8 |
|
BW Quartile Q2 |
Animal Count 51,375 |
Average gBW 102 |
Average KGMS 486 |
Average LWGT gBV 37 |
Average FERT gBV -0.2 |
|
BW Quartile Q3 |
Animal Count 51,375 |
Average gBW 60 |
Average KGMS 467 |
Average LWGT gBV 37 |
Average FERT gBV -1 |
|
BW Quartile Q4 |
Animal Count 51,375 |
Average gBW -0.8 |
Average KGMS 445 |
Average LWGT gBV 38.6 |
Average FERT gBV -2.1 |
KiwiCross
|
BW Quartile |
Animal Count |
Average gBW |
Average KGMS |
Average LWGT gBV |
Average FERT gBV |
|---|---|---|---|---|---|
|
BW Quartile Q1 |
Animal Count 146,050 |
Average gBW 208 |
Average KGMS 505 |
Average LWGT gBV -4.1 |
Average FERT gBV 1.3 |
|
BW Quartile Q2 |
Animal Count 146,050 |
Average gBW 152 |
Average KGMS 478 |
Average LWGT gBV 0.7 |
Average FERT gBV 0.5 |
|
BW Quartile Q3 |
Animal Count 146,050 |
Average gBW 110 |
Average KGMS 464 |
Average LWGT gBV 5.2 |
Average FERT gBV -0.2 |
|
BW Quartile Q4 |
Animal Count 146,048 |
Average gBW 47 |
Average KGMS 442 |
Average LWGT gBV 10.7 |
Average FERT gBV -1.2 |
Jersey
|
BW Quartile |
Animal Count |
Average gBW |
Average KGMS |
Average LWGT gBV |
Average FERT gBV |
|---|---|---|---|---|---|
|
BW Quartile Q1 |
Animal Count 18,988 |
Average gBW 252 |
Average KGMS 431 |
Average LWGT gBV -50.4 |
Average FERT gBV 2.9 |
|
BW Quartile Q2 |
Animal Count 18,988 |
Average gBW 202 |
Average KGMS 404 |
Average LWGT gBV -50.9 |
Average FERT gBV 2.2 |
|
BW Quartile Q3 |
Animal Count 18,988 |
Average gBW 166 |
Average KGMS 387 |
Average LWGT gBV -51.2 |
Average FERT gBV 1.5 |
|
BW Quartile Q4 |
Animal Count 18,988 |
Average gBW 87 |
Average KGMS 382 |
Average LWGT gBV -51.7 |
Average FERT gBV 0.1 |
- To calculate the ‘rate of genetic gain’, the difference in genomic Breeding Worth between one year of replacements versus the following year was compared.
- Average rate of genetic gain for herds with more than 80% of their progeny sired by LIC bulls over the last 10 years (2,900 herds)
2012-2016 – 10 gBW per annum
2017-2021 – 19 gBW per annum - Average rate of genetic gain for herds with less than 20% of their progeny sired by LIC bulls over the last 10 years (474 herds)
2012-2016 – 7 gBW per annum
2017-2021 – 10 gBW per annum